Monday Developments issue on NGO accountability

(via Niels Keijzer on the Pelikan email list)

The December 2007 issue of Monday Developments, a monthly magazine
published by InterAction (the largest coalition of NGOs in the United
States), explores key accountability issues for NGOs. Through various
angles, the issue looks into “(…) the conflicts organizations face with
scarce resources, demanding missions and the need to evaluate progress and
effectiveness.”

The articles include views on the topic from development donors, the
Humanitarian Accountability Project, the importance of listening for
accountability, implications for evaluation standards and practice,
downward accountability, …

You can download the magazine here:
http://www.interaction.org/files.cgi/6117_MDDec2007.pdf

The Social Framework as an alternative to the Logical Framework

  1. A Social Framework
  2. The basic idea
  3. Other differences between the Social and Logical Framework
  4. Potential complications
  5. Relation to Outcome Mapping
  6. Related posts
  7. Postscripts

1. A Social Framework…

  • is a format for describing an expected pathway of influence through a wider network of people, groups or organisations.
  • is a Logical Framework re-designed as if people and their relationships mattered
  • is a way of summarizing the theory-of-change within a development project, in a form that can be monitored and evaluated. And which can be easily explained to others.

The Social Framework uses the idea of pathways as a bridging concept, which can connect up two very different ways of thinking about development projects. One is the Logical Framework, which provides a very linear view of development, where events happen in a sequence of  steps, in one direction. The other is a network view of development, where change can be taking place simultaneously, in many different locations, in the relationships between many different actors.

2. The basic idea

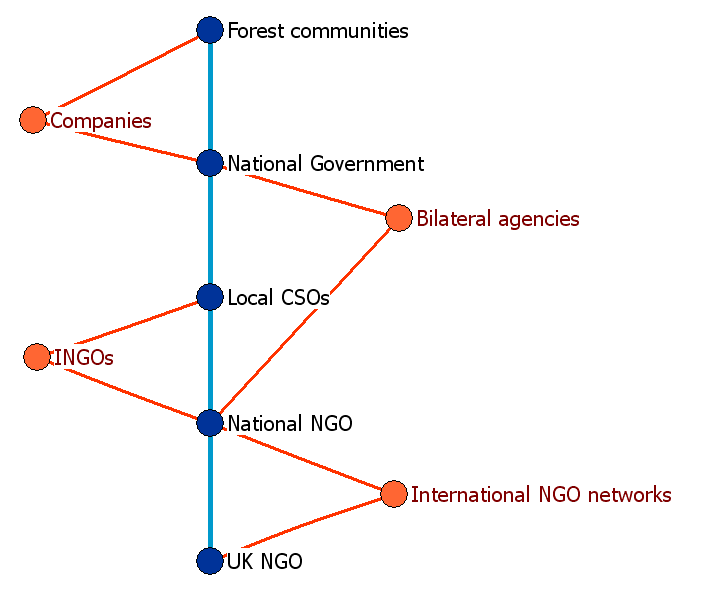
The diagram below shows a number of actors, connected by relationships. It is a simple network diagram, that can be drawn using Excel or social network analysis software. The thick blue line shows a particular pathway through that network that is of interest. What is expected to happen along that pathway can be described in detail using a Social Framework format, which itself is an adaptation of the Logical Framework.
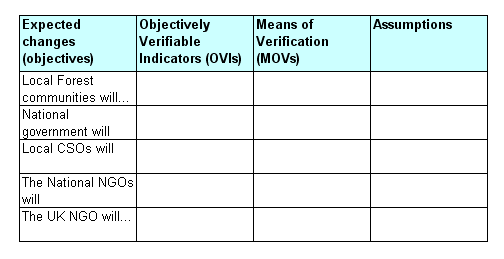
In the table below each of the actors that are on the blue pathway above have been given a row, where the expected changes in that actor’s behavior can be described in detail. The rows of actors are in the same sequence as the chain of actors in the diagram above.

Unlike the Logical Framework, there can be as many rows in the tables as needed, depending on how long the chain of actors is along the pathway. The concept of a chain of relationships has some similarity with the concepts of  Value Chains and Supply Chains

3. Other differences between the Social and Logical Framework

The two frameworks appear very similar in that both describe an intended process of change as a series of events taking place across a sequence of rows. Starting at the bottom and going upwards. But there are important differences…

1. Time versus people

In the Logical Framework this vertical dimension represents the flow of time, starting from the present at the bottom and moving to the future at the top. This flow is broken into different stages, represented by each row. The types of events taking place in each of these rows are given different names, typically: Activities, Outputs, Purpose (or outcome) and Goal (or impact). One of the challenges facing users of the Logical Framework is agreeing on where events should be placed within which categories. For example, as activities or outputs, or as outcomes or impacts. Communicating the difference between these categories to non-specialists is even more of a challenge.

In the Social Framework the vertical dimension represents a chain of actors connected by their relationships. Actors can be individuals, organisations or groups, or larger categories of organisations or groups. This choice depends on the scale of the event that needs to be described by the Social Framework. In the Social Framework, the relationships between actors are the means by which change happens. In the Logical Framework change is often described in more abstract terms.

2. Length and direction of influence

Unlike the four rows in the Logical Framework, this chain can be as long or short as is needed. Unlike the Logical Framework causation is likely to work in both directions, up and down the chain of relationships. Actors influence others, and they are also influenced by those others.

3. Using the traditional four columns

Both the Social and Logical Framework involve the use of four columns: a narrative description of the expected change, observable indicators of those changes (OVIs), sources of information on those indicators (MoVs), and assumptions about those changes’ relationships to wider events. The Social Framework design has deliberately kept, but adapted, these elements of the Logical Framework.

The narrative column describes the expected changes in the actors (and their relationships with each other). In the Logical Framework the narrative description is expected to be written in a depersonalised passive voice. In contrast,  the actor-centred description in the Social Framework will make it much easier to understand and communicate, the “storyline”.

The MoV column does not simply say where the necessary information (about the expected changes) can be found, but also who will know about these changes. Information needs to be known about by someone to be of any use. Information that exists but is not known to anyone is in effect useless.

The assumptions column describes what other relationships will also be important, because their actions (or inaction) may affect what happens to the actor in each row of the Social Framework. It is important to remember that most Social Frameworks will describe a chain of actors forming a pathway through a wider and more complex network of relationships. For example, in the table above the Assumptions section of the row describing the National NGO should say something about what is expected of their relationships with bilateral agencies and INGOs, which they also have relationships with (shown by the orange links in the diagram).

In a Social Framework there is still a connecting logic between the different rows, as there is in the Logical Framework. However, it is a social logic, with this type of form:

If the National NGO is able to provide technical advice on advocacy strategies to the Local CSOs…

And INGOs continue to fund those Local CSOs for at least three years…

Then the Local CSOs will be able to engage more effectively with the National Government

4. Distributed accountability

One of the potential benefits of the Social Framework is that because there are change objectives for each actor in a pathway, responsibility for the whole chain functioning as intended is distributed amongst all the actors in that pathway. In Logical Framework descriptions of projects, responsibility for success often seems to lay almost solely with one organisation, usually that one closest to the intended beneficiaries. For more on this idea, see my blog posting on distributed accountability in the Katine project in Uganda

5. Potential complications

1. Multiple pathways

In a given project setting there may be more than one pathway. In the diagram above it is quite likely that the National NGO is communicating with the INGOs and with some Bilateral Agencies. The INGOs might be interacting with the Companies as well as Local CSOs. Where these parallel strategies are an important part of the overall project design these auxiliary pathways could be documented in supporting Social Frameworks. Their existence could be referred to in the appropriate Assumptions cell of the central Social Framework.

These relationships can also be shown graphically, using what are called ego-network diagrams. In the above example, the UKNGO is the “ego” in the networks and those others they are in direct contact are the “alters“. The diagram then also shows relevant relationships between the alters.  Those alters could then become the ego in another ego-network diagram, showing a wider sub-set of relevant relationships.

2. Multiple views of how someone should change

For any given actor in a chain of relationships there may be different views about how they should change (e.g. they will have their own view, and so will others in immediate relationships with them). How do you reconcile these different views?

If the Social Framework was developed through a participatory process then these differences should be expected to arise during that process and may be resolved. It should be relatively easy to design a Social Framework by participatory means because each stakeholder should be able to see where they fit into the picture, either directly as an actor in the pathway, or indirectly via an Assumptions statement in one or more of the rows.

If the Social Framework was developed to reflect the views of one stakeholder, then their conflicting view of how another actor needs to change may limit their ability to affect change down a given pathway.  Or, on discovering that there is a difference in views, they may then try to persuade the other to change in the way they think is needed, and end up being successful. This might be the case with the Local CSOs relationship with National Government, in the simple diagrammatic view shown above.

3. How do you fit short term, medium term and long term changes in Social Framework?

For a given actor there may be different objectives (expected changes) for different time periods. In the short term they may be to be able to do x, in the medium term they may hope to be to do y and in the long term they may want to be to do z.  Multiple objectives can be listed, in time order, within each actor’s own row. Similarly with the indicators for each of these in the next column.

Changes in the short versus long term can also be captured by describing multiple pathways, some of which are important in the early stages of a project and some which are more important later on, during and after the project ends.

6. Relation to Outcome Mapping

Both the Social Framework and Outcome Mapping are actor-focused approaches. Louise Shaxson and Ben Clench (2011) have written on how they can be combined. Elsewhere, I have written a one-pager looking at the similarities and differences between Outcome Mapping and Network Models (which Social Frameworks relate to).

If people are using Outcome Mapping but also want something like the Logical Framework to summarise the project intentions (and theory of change) then the following interpretations might be useful:

  • In a Social Framework, adjacent actors are each others’ Boundary Partners. Other actors mentioned in the Assumptions column of a given actor might also become their Boundary Partners.
  • Outcome Challenges are the expected changes to be described in the first column, for each actor in the Social Framework
  • Progress markers could be listed in the Indicators column, for the respective Boundary Partner
  • Strategy maps could be described using a network diagram similar to the one used immediately above. Each pathway would need to be highlighted, including their relative importance.

7. Postscript

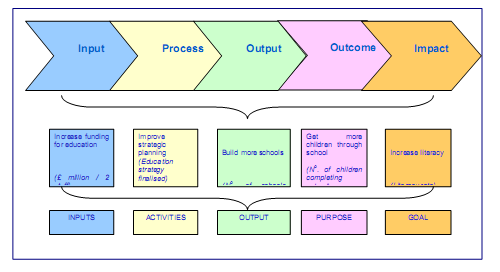
1. 2011: I have just been re-reading the new DFID “Guidance on using the revised Logical Framework”  On page 9 there is a graphic illustrating an “example of a Results Chain and how it aligns with the logframe format” It interested me because it is a good example of yet another disembodied theory of change, where changes happen but there are no identifiable actors present (except children at Purpose level). This must make the process of monitoring and evaluation more difficult (even in this simple example) and make communication of the project design to others more difficult also.
 

2.  2011 05 18: Recently in the course of other work I came across this OECD DAC definition of impact: “Positive and negative, primary and secondary long-term effects produced by a development intervention, directly or indirectly, intended or unintended.” Interpreted literally this focus on the long-term could mean that any changes during a project implementation period, commonly three years, would not be considered to be a kind of impact. This could be a bit of a problem in projects aimed at reducing infant or child mortality by improving the quality of health service provision. In the case of maternal and infant health projects, it would be commonly expected that some reductions in the numbers of cases of child and maternal deaths would occur within a project’s lifespan. In fact, the sooner these kinds of changes happened the better.

However, if impact was defined in a different way then kind of this perverse anomaly would not arise. Impact could be defined in terms of social rather than temporal distance, as changes in the lives of people of ultimate concern. In this case, it is mothers and infants, who are at the end of one or more chains of actors, through which aid resources and their effects flow. The Social Framework uses this concept of social distance, whereas the vertical structure of the Logical Framework uses either temporal distance or a conflation of social and temporal distance.

3.  2011 10 28. In February this year Louise Shaxson & Ben Clench, of the Delta Partnership, published a 10 page Working Paper titled “Outcome mapping and social frameworks: tools for designing, delivering and monitoring policy via distributed partnerships” “Partnership working is becoming increasingly important in the policymaking process: no more so than in the UK with the coalition government’s ‘Big Society’ agenda. But the problem is not limited to the UK: the international search for hybrid forms of governance takes on a new urgency as we move towards an era of light touch regulation, small government, and localism. This paper describes two tools which will help policymakers take a rigorous approach to designing, delivering and monitoring policymaking in the face of these complex issues.”

4. 2016 04 16: Since writing the above postings I have had two related ideas. The first is that I have for a long time been ambivalent about what should be described at each level in the Social Framework (as described in the tabular format above) – should it be an actor or a relationship between two actors, or both (i.e. row 1 describes actor A, row 2 describes relationship between actors A & B, row 3 describes actor B, etc). Events described in rows that refer to specific actors (if they are organisations)  are essentially happening in a more micro-level set of relationships i.e. within the organisation concerned)

The other idea relates to how you would map the network structure that contains the pathways and surrounding relationships we are interested in. I now think this could be done using something called a greedy algorithm, whereby the exploration of one actor’s ego network would lead on to the exploration of the ego network of the most important actor in the first ego network, and so on. The most important relationship in each ego network (and thus connecting ego networks) would be the causal pathway we would be interested in. In network analysis terms this would be known as a “maximal spanning tree”. Of course, what constituted “most important actor” would have been to be defined in advance of what would in effect be a participatory network mapping exercise.

5. 2020 12 12: Some interesting more recent related developments

.

ParEvo – a web assisted participatory scenario planning process

The purpose of this page

…is to record some ongoing reflections on my experience of running two pre-tests of ParEvo carried out in late 2018 and early 2019.

Participants and others are encouraged to add their own comments, by using the Comment facility at the bottom of this page

Two pre-tests are underway

  • One involves 11 participants developing a scenario involving the establishment of an MSC (Most Significant Change) process in a development programme in Nigeria. These volunteers were found via the MSC email list. They came from 7 countries and 64% were women.
  • The other involves 11 participants developing a Brexit scenario following Britain failing to reach an agreement with the EU by March 2019. These participants were found via the MandE NEWS email list. They came from 9 countries and 46% were women.

For more background (especially if you have not been participating) see this 2008 post on the process design and this 2019 Conference abstract talking about these pre-tests

Reflections so far

Issues arising…

  1. How many participants should there be?
    • In the current pre-tests, I have limited the number to around 10. My concern is that with larger numbers there will be too many story segments (and their storylines) for people to scan and make a single preferred selection. But improved methods of visualising the text contributions may help overcome this limitation. Another option is to allow/encourage individual participants to represent teams of people, e.g. different stakeholder groups. I have not yet tried this out.
  2. Do the same participants need to be involved in each iteration of the process?
    1. My initial concern is that not doing so would make some of the follow up quantitative analysis more difficult, but I am not so concerned about that now, its a manageable problem. On the other hand, it is likely that some people will have to drop out mid-process, and ideally, they could be replaced by others, thus maintaining the diversity of storylines.
  3. How do you select an appropriate topic for a scenario planning exercise?
    1. Ideally, it would be a topic that was of interest to all the participants and one which they felt some confidence in talking about, even if only in terms of imagined futures. One pre-test topic, the use of MSC in Nigeria, was within these bounds. But the other was more debatable: the fate of the UK after no resolution of BREXIT terms by 29th March 2019
  4. How should you solicit responses from participants?
    1. I started by sending a standard email to all the (MSC scenario) participants, but this has been cumbersome and has risks. It is too easy to lose track of who contributed what text, to add to what existing storyline. I am now using two-part single question survey via SurveyMonkey. This enables me to keep a mistake-free record of who contributed what to what, and who has responded and who has not. But this still involves sending multiple communications, including reminders, and I have sometimes confused what I am sending to whom.  A more automated systems is definitely needed.
  5. How should you represent and share participants responses?
    1. This has been done in two forms. One is a tree diagram, showing all storylines, where participants can mouseover nodes to immediately see each text segment. Or they can click on each node to go to a separate web page and see complete storylines. These are both laborious to construct, but hopefully will soon be simplified and automated via some tech support which is now under discussion. PS: I have now resorted to only using the tree diagram with mouseover.
  6. Should all contributions be anonymous?
    1. There are two types of contributions: (a) the storyline segments contributed during each iteration of the process, (b) Comments made on these contributions, that can be enabled on the blog page that hosts each full storyline to date. This second type was an afterthought, whereas the first is central to the process.
    2. The first process of contributing to storylines designed to make authorship anonymous, so people would focus on the contents.  I think this remains a good feature.
    3. The second process of allowing people to comment has pros and cons. The advantage is that it can enrich the discussion process, providing a meta-level to the main discussion which is the storyline development. The risk, however, is that if the comments are not enabled to be anonymous then a careful reader of the comments can sometimes work out who made which storyline contributions. I have tried to make comments anonymous but they still seem to reveal the identity of the person making the comment. This may be resolvable. PS: This option is now not available, while I am only using the tree diagram to show storylines. This may need to be changed.
  7. How many iterations should be completed?
    1. It has been suggested that participants should know this in advance, so that their story segments don’t leap in the future too quickly, or the reverse, progress the story too slowly. With the Brexit scenario pre-test I am inclined to agree. It might help to saying at the beginning that there will be 5 iterations, ending in the year 2025. With the MSC scenario pre-test I am less certain, it seems to be moving on at a pace I would not have predicted
    2. I am now thinking it may also be useful to spell out in advance the number of iterations that will take place. And perhaps even suggest each one will represent a given increment in time, say a month or a year, or…
  8. What limits should there be on the length of the text that participants submit?
    1. I have really wobbled on this issue, ranging from 100-word limits to 50-word limits to no voiced limits at all. Perhaps when people select which storyline to continue the length of the previous contributions will be something they take into account? I would like to hear participants views on this issue. Should there be word limits, and if so, what sort of limit?
  9. What sort of editorial intervention should there be by the facilitator, if any?
    1. I have been tempted, more than once, to ask some participants to reword and revise their contribution. I now limit myself to very basic spelling corrections, checked with the participant, if necessary. I was worried that some participants have a limited grasp of the scenario topic, but now think that just has to be part of the reality, some people have little to go on when anticipating specific the future, and others may have “completely the wrong idea”, according to others. As the facilitator, I now think I need to stand back and let things run.
    2. Another thought I had some time ago is that the facilitator could act as the spokesperson for “the wider context”, including any actors not represented by any of the participant’s contributions so far. At the beginning of a new iteration, they could provide some contextual text that participants are encouraged to bear in mind when designing their next contribution. If so, how / where should this context information be presented?
  10. How long should a complete exercise take?
    1. The current pre-tests are stretching out over a number of weeks. But I think this will be an exception. In a workshop setting where all participants (or teams of) have access to a laptop and internet, it should be possible to move through a quite a few iterations within a couple of hours. In other non-workshop settings perhaps a week will be long enough, if all participants have a stake in the process. Compacting the available time might generate more concentration and focus. The web app now under development should also radically reduce the turnaround time between iterations because manual work done by the facilitator will be automated.
  11. Is my aim to have participants evaluate the completed storylines realistic?
    1. After the last iteration, I plan to ask each participant, probably via an online survey page, to identify: (a) the most desirable storyline, (b) the most likely to happen storyline. But I am not sure if this will work. Will participants be willing to read every storyline from beginning to end? Or will they make judgments on the basis of the last addition to each storyline, which they will be more familiar with? And how much will this bias their judgments (and how could I identify if it does)?
  12. What about the contents??
    1.  One concern I have is the apparent lack of continuity between some of the contributions to a storyline. Is this because the participants are very diverse? Or because I have not stressed the importance of continuity? Or because I can’t see the continuity that others can see?
    2. What else should we look for when evaluating the content as a whole? One consideration might be the types of stakeholders who are represented or referred to, and those which seem to be being ignored
  13. How should performance measures be used?
    1. Elsewhere I have listed a number of ways of measuring and comparing how people contribute and how storylines are developed. Up to now, I have thought of this primarily as a useful research tool, which could be used to analyze storylines after they have been developed.
    2. But after reading a paper on “gamification” of scenario planning it occurred to me that some of these measures could be more usefully promoted at the beginning of a scenario planning exercise, as measures that participants should be aware of and even seek to maximize when deciding how and where to contribute. For example, one measure is the number of extensions that have been added to a participant’s texts by other participants, and the even distribution of those contributions (known as variety and balance).
  14. Stories as predictions
    1. Most writers on scenario planning emphasize that scenarios are not meant to be predictions, but more like possibilities that need to be planned for
    2. But if ParEvo was used in a M&E context, could participants be usefully encouraged to write story segments as predictions, and then be rewarded in some way if they came true? This would probably require an exercise to focus on the relatively near future, say a year or two at the most, with each iteration perhaps only covering a month or so.
  15. Tagging of story segments
    1. It is common practice to use coding / tagging of text contents in other settings. Would it be useful with ParEvo? An ID tag is already essential, to be able to identify and link story segments.
  16. What other issues are arising and need discussion?
    1. Over to you…to comment below
    2. I also plan to have one to one skype conversations with participants, to get your views on the process and products

Pre-2008 contents of the MandE NEWS website (part 2)

Please ignore this post. It has been produced in order to facilitate Google searches of this website

Index of /docs

VisuaLyzer software: for visualising and analysing networks

There are now many different software packages available that can be used to visually represent networks, and to generate many different statistical measures of their structure. Unfortunately many of these involve a steep learning curve, and involve far more bells and whistles than I need.  VisuaLyzer is my favourite software package because it is very user friendly, and easy to use.

VisuaLyzer is produced by mdlogix, USA. You can download a trial version or buy a copy from this part of their website. For more information contact Allen Tien <allen@mdlogix.com> at mdlogix. If you do contact him, please mention you heard about Visualyser on Rick Davies’s website, MandE NEWS.

My main use of Visualyzer is to draw the organisational networks I am working with, in the course of my work as an M&E consultant on development aid programmes. These are of two types: (a) literal descriptions (maps) of the relationships as known, (b) simplified models of complex networks showing the main types of organisations and the relationships between them. Less frequently, I also import data from Excel to automatically generate network maps. This data usually comes from project documents or online surveys. I also use the combination of UCINET and Netdraw for this task.

Here is an example of a network that I drew by hand directly on screen. It represents the relationships between AMREF’s partners in the Katine project, Uganda. Click on the image to expand it a new window, then click again to get a focused image. You can represent different types of actors by varying the colour, size and shape of nodes. You can represent the different kinds of relationships between them by varying the kind of line used, its colour and thickness. If you click on a node you can enter detailed text or numerical data describing the actor’s attributes, using as many fields as needed. If you click on any link you can enter data about the attributes of that relationships. Both of these sets of data can be exported, on all actors and relationships, as an Excel file.  You can also import the same kind of data, to automatically generate a network diagram.

mdlogix describe it as “an interactive tool for entering, visualizing and analyzing network data. You can create nodes and links directly or import network data from edgelist/edgearray, Excel, or GraphML formats. Once the network is displayed, you can customize visual properties such as the colour, shape, size, and location of nodes and links to create an informative graphic representation. Images of your choice may be used to represent nodes. XY mapping of nodes as a function of node attributes is supported in layered layout. It also provides a number of analysis functions for calculating network and nodal level indices, and for finding sub-groups, partitions, communities, and roles and positions. In addition, VisuaLyzer includes powerful logic programming capabilities that allow you to investigate networks using axioms of classical set theory.”

This all sounds quite complex. But in practice it is the simplest features of Visualyzer which are the most useful. It does have a very good and easy to read Users Guide (5mb), which you may want to look at.

For more on the development of network models / descriptions and their use in monitoring and evaluation go to the Network Models section of this website.

POSTSCRIPT (1st December 2008): See also Overview of Common Social Network Analysis Software Platforms “This report was developed by the Philanthropy and Networks Exploration, a partnership between the Packard Foundation and Monitor Institute. The exploration is an inquiry into how networks can facilitate greater philanthropic effectiveness. For more information, please go to http://www.philanthropyandnetworks.org

PS2 (16th January 2009): The link to the “Overview …” doc no longer works. I have now uploaded the doc HERE, after receiving a copy via the Pakard Foundation. They also sent a link to: “Working Wikily: How networks are changing social change

Networks and evaluation

This page is about two complementary perspectives: the evaluation of networks, and how a network perspective can inform the design and evaluation of development programs (which may not have been designed as networks)

Please note that the contents of this page has been cut and pasted from the old MandE NEWS website. All links go to contents on the old site. The old contents will be moved to the new website as soon as possible.

Predicting the achievements of the Katine project

September 2010: This post provides information on a revised proposal for a “Predictions Survey” on the achievements of the Katine Community Partnerships Project, a project managed by AMREF and funded by the Guardian and Barclays Bank, between 2007 and 2011.

Background Assumptions

The Guardian coverage of the Katine project has provided an unparalleled level of public transparency to the workings of an aid project. As of August 2010 there have been approximately 530 articles posted on the site, most of which have specifically about Katine. These posts have included copies of project documentation (plans, budgets, progress reports, review reports) that often don’t enter the public realm.

Ideally this level of transparency would have two benefits: (a) improving UK public knowledge about the challenges of providing effective aid, (b) imposing some constructive discipline on the work of the NGO concerned, because they know they are under continuing scrutiny not only locally, but internationally. Whether this has actually been the case is yet to be systematically assessed. However I understand the effects on the project and its local stakeholders  (i.e b above) will be subject to review by Ben Jones later this year, and then open to discussion in a one day event in November, to be organised by the Guardian.

So far there have been two kinds of opportunities for the British, and other publics, to be engaged with the public monitoring of the Katine project. One has been through posting comments on the articles on the Guardian website. About 30% of all articles have provided this opportunity, and these articles have attracted an average of 5 comments . The other option has been by invitation from the Guardian, to make a guest posting on the website. This invitation has been extended to specialists in the UK and elsewhere.  Multiple efforts have also been made to hear different voices from within the Katine community itself

The Predictions Survey would provide another kind of opportunity for participation. It would be an opportunity for a wide range of participants to:

  • to make some judgments about the overall achievements of the project, and
  • to explain those judgments, and
  • to see how those judgments compared to that of others, and
  • to see how those judgments compare to the facts, about what has actually been achieved at the end of the project

In addition a Predictions Survey would provide a means of testing expectations that greater transparency can improve public knowledge about the challenges of providing effective aid.

My proposal is that that the Prediction Survey would consist of five batches of questions, one for each project component, on a separate page. Each question would be a multiple choice question, but associated with an optional Comment field. People could respond on the basis of their existing knowledge of the project (which could vary widely) and/or extra information about the website obtained via component specific links embedded at the head of each page of the online survey e.g. on water and sanitation. Questions at the end of the survey would identify participants’ sources of knowledge about the project (e.g. obtained before and during the survey, from the website and elsewhere).

A 1st rough draft survey form is already available to view. Any responses entered at this stage may be noted, but they will then be deleted and not included in any final analysis.  The final design of the survey will require close consultation with AMREF and the Guardian.

Intended participants in the survey

  • UK public, reached via the Guardian
  • Uganda public, reached via Ugandan newspapers (likely to be more of a challenge)
  • AMREF staff, especially in Uganda, Kenya HQ and UK
  • The Guardian and Barclays, as donors
  • Monitoring and Evaluation specialists, reached via an international email list

Hypotheses (predictions about the predictions)

  1. We might expect that AMREF would be able to make the most accurate predictions, given its central role. But aid agencies are often tempted to put a gloss on their achievements, because of the gap that sometimes emerges between their ambitions and what can actually be done in practice.
  2. We might expect that participants who have been following the Guardian coverage closely since the beginning might be better informed and make better predictions than others who have become interested more recently. But perhaps those participants are still responding on the basis of their original beliefs (aka biases)?
  3. We might expect M&E specialists to make better than average predictions because of their experience in analysing project performance. But perhaps they have become too skeptical about everything they read
  4. We might expect the Guardian and Barclays staff to make better than average predictions because they have been following the project closely since inception and their organisation’s money is  invested in it. But perhaps they only want to see success.
  5. We might expect the highest frequency choices (across all groups) to be more accurate than the choices of any of the above groups, because of a ” wisdom of crowds” effect. The potential of crowdsourcing was of interest to the Guardian at the beginning of the project, and this survey could be seen as a form of crowdsourcing – of judgements.

This list is not final. Other hypotheses  could be identified in the process of consultation over the design of the survey

There may also be other less testable predictions worth identifying. For example, about the effects of this Prediction Survey on the work done by AMREF and its partners in the final year up to October 2011. Might it lead to a focus on what is being measured by the survey, to the detriment of other important aspects of their work?  If AMREF has a comprehensive monitoring framework and the prediction survey addresses the same breadth of performance (and not just one or two performance indicators) this should not be a problem.

Timeframe

The fourth and final year of the project starts in October 2010 and ends in October 2011.

The finalisation of the design of the Predictions Survey will require extensive consultation with AMREF and the Guardian, in order to ensure the fullest possible ownership of the process, and thus the results that are generated. Ideally this process might be completed by late-October 2010

The survey could be open from late October to the end of March 2011 (six months before the end of the project). All responses would be date stamped to take account of any advantages of being a later participant

A process will need to be agreed in 2010 on how objective information can be obtained on which of the multiple choice options have eventuated by October 2011.

A post 2011 follow up survey may be worth considering. This would focus on predictions of what will happen in the post-project period, up to 2014, the year of the vision statement produced by participants in the September 2009 stakeholders workshop in Katine.

“In 2014, Katine will be an active, empowered community taking responsibility for their development with decent health, education, food security and able to sustain it with the local government”

Supporters

The participation of the Guardian and AMREF will be very important, although it is conceivable that the survey could be run independently of their cooperation

Assistance with publicity, to find participants, would be needed from the Guardian and Barclays

Advisory support is being sought from the One World Trust

Advisory support from other other organisations could also be useful

The online survey could be designed and managed by Rick Davies. However responsibility could be given to another party that was agreed to by AMREF, Guardian and Barclays.

Challenges

  • The survey design needs to be short enough to encourage people to complete it, but not so short that important aspects of the project’s performance are left out
  • The description of the objectives used in the survey needs to be as clear and specific as possible, but also keep as close to AMREF’s original words as possible (i.e. as in the 4th year extension proposal, and using the M&E framework, now being updated)
  • Participants will be asked to make a single choice between multiple options, describing what might happen. These options will need to be carefully chosen, so there are no obvious “no brainers”, and to cover a range of plausible possibilities
  • It may be necessary in some cases (e.g. with some broadly defined objectives) to allow multiple choices from multiple options
  • I have heard that AMREF will be conducting a final evaluation in late 2011, using an external consultant. This evaluation could be the source of the final set of data on actual performance, against which participant’s predictions could be compared. But will it be seen as a sufficiently independent source of information?

A digression on complexity and networks…

….a side argument from the Rick on the Road post: Cynefin Framework versus Stacey Matrix versus network perspectives

In that post I said

PS1:Michael Quinn Patton’s book on Developmental Evaluation has a whole chapter on “Distinguishing Simple, Complicated, and Complex”. However, I was surprised to find that despite the book’s focus on complexity, there was not a single reference in the Index to “networks”. There was one example of a network model (Exhibit 5.3) , contrasted with a Linear Program Logic Model…” (Exhibit 5.2), in the chapter on Systems Thinking and Complexity Concepts. [I will elaborate further]

One interpretation: Complexity arises through the interaction of many agents having some degree of autonomy. With no autonomy there is simple order (complete predictability), with complete autonomy there is chaos (no predictablity). How do we define autonomy? One view: Autonomy = The number of possible relationships an actor can have with others. When realised, this can be measured in terms of  network density (a Social Network Analysis (SNA) measure). Two cariacature examples of the extremes: 1. An army, with a hierarchical chain of command,  is highly ordered. Here the network structure is  sparse (i.e.  a tree structure) and low in density. 2. “Economic man” , who is free to interact with anyone, in order to maximise his/her utility. Here all possible relationships can be realised, as everyone interacts with everyone. Complexity is the territory in between where actors have some degree of choice of who they interact with. And where there is some degree of predictability. When realised, those choices can also be described in terms of different kinds of network structures. So if we want to explore complex systems we need to look at the structure of networks of actors, both as “initial conditions” affecting what happens next and as “final states”, reflecting what has happened over a given period of time. I.e. an empirical approach, not mysticism :-)

PS: The concept of autonomy could probably be further differentiated, in terms of relationship choices, as follows : (a) the range of relationships available to an actor, already discussed above (b) the freedom to choose amongst those that are available, (c) the range of behaviors available within a given relationship. But how do you measure freedom (b) ? One measure might be the degree to which any choices made are uncorrellated with other events. The diversity of choices made could also be important. Diversity suggests freedom from constraint (more on this theme here).

Making government budgets more accessible and equitable

(from ID21)

Involvement in the budget process in poor countries has traditionally been limited to a select group of political actors. But this has changed over the last decade with legislators, civil society groups and the media playing a more active role. What impact is broader engagement having?

Research from the Institute of Development Studies, UK, examines the substance and impact of applied budget work undertaken by civil society groups. The research draws on six case studies of independent budget work in Brazil, Croatia, India, Mexico, South Africa and Uganda. One focus of the research is how civil society budget work influences government budget priorities and spending in a way that benefits poor and socially excluded groups.

Budget work is carried out by various types of organisations including non-government organisations (NGOs), networks and social movements, and research organisations. All the groups examined in the case studies share a commitment to increasing the influence of poor and marginalised groups in the budget process and ensuring that budget priorities reflect the needs of these groups.

The six organisations all engage in certain core activities centred on data analysis and dissemination, advocacy and capacity building. Most work on national and state-level budgets, though several groups also work at the local government level.

The research shows that independent budget work has the potential to deepen democracy by strengthening accountability, fostering transparency and encouraging participation. It can also increase financial allocations in areas that contribute to social justice and equity outcomes and ensure that public money is efficiently spent.

The research also reveals the limits to budget work. Any increases in financial allocations secured as a result of advocacy initiatives are likely to represent a small share of overall government spending. Also, the scope of budget work to influence financial allocations depends on the openness and flexibility of the budget process (spending priorities may not be open to change).

The impacts of budget work identified by the research include:

  • improving the transparency of budget decisions and budget processes and increasing the accountability of state actors
  • increasing awareness and understanding of budget issues
  • improving budget allocations in a way that benefits poor and socially excluded groups
  • ensuring better use of spending, for example in areas such as health and education, and reducing corruption (by tracking expenditures)
  • diversifying the range of actors engaged in budget processes (for example, legislators, civil society groups and the media)
  • strengthening democracy and deepening participation.

The research concludes that:

  • Budget work has been successful in a range of areas, including improving equity and social justice outcomes.
  • The technical nature of the budget process limits the scope for broadening citizen participation.
  • The challenge for budget groups is how to scale-up and replicate the successful impacts achieved to date.
  • Influencing budget policies requires a combination of sound technical knowledge, effective communications and strategic alliances.
  • Promoting the voice of poor and socially excluded groups is an important indirect effect of budget work.

Source(s):
‘Budget Analysis and Policy Advocacy: The Role of Non-governmental Public Action’, IDS Working Paper 279, IDS: Brighton, by Mark Robinson, 2006 Full document.

Funded by: UK Economic and Social Research Council

id21 Research Highlight: 16 August 2007

Further Information:
Mark Robinson
Policy and Research Division
UK Department for International Development (DFID)
1 Palace Street
London SW1E 5HE
UK

Tel: +44 (0)20 70230000
Fax: +44 (0)20 70230636
Contact the contributor: mark-robinson@dfid.gov.uk

%d bloggers like this: