A free browser tool for sorting a set of texts into groups, and for finding out what actually distinguishes those groups.
You give it a collection of documents: interview transcripts, Most Significant Change stories, grantee reports, scenario narratives. You say what kind of difference interests you. It proposes difference-based criteria that separate the texts, scores each text against each criterion, and builds a dendrogram (a nested classification) from the result. Then you can interrogate that dendrogram in plain language, using a built-in LLM interface.
It runs entirely in your browser. There is nothing to install and no account to create.
Contents
What problem it solves
If you have a hundred texts and want to know how they differ, you have had two options.
- Code them. Read each one, annotate passages, build a codebook, iterate. This is thorough and slow, and it works within documents, locating where themes appear, which is the wrong grain if your question is how whole documents differ from one another.
- Cluster them by machine. Fast, but conventional text clustering groups documents on a numerical representation, embeddings, topic distributions, that nobody inspects. You get groups, and then you reverse-engineer an explanation by reading exemplars and squinting. The explanation is something you attach afterwards; it is not what produced the grouping.
The Lab takes a third route. The features are stated in plain English before any clustering happens, and the distances are computed from them. So every branch of the tree can already say what separates it from its sibling, in the same terms the algorithm used. The explanation is not bolted on. It is the thing that did the work.
How it works
- You set the frame. Two short prompts: what kind of texts these are, and what kind of difference should be looked for e.g. differences in outcomes, in who is involved, in the values at stake. This is the analytic decision, and it stays with you.
- Criteria are proposed. The model reads your set of texts and proposes sorting criteria relating to the kind of difference you asked for: statements that some texts meet and others do not. You see them, in full, with an explanation of what each one implies. You can drop any of them, and you can write your own.
- Every text is scored. Each text is assessed against each criterion. The result is a binary matrix you can inspect, sort, export, and take elsewhere.
- Texts are clustered. Similarity is simply the number of criteria two texts share. Agglomerative clustering (UPGMA) builds a dendrogram from those similarities. You choose how many groups to cut it into, and you can see which criteria are holding any particular split together.
- You question the result. The Query tab lets you put questions to the whole set, to any selected pair of sibling groups, or to a single group. E.g. Whose perspectives dominate here, and whose are missing? Which group offers verifiable detail rather than general assertion? If a panel had to choose between these two groups, what case could be made for each?
Try it
Current version: Vs137 11 September, 2026
You will need an Anthropic API key, obtainable from console.anthropic.com. The key stays in your own browser and is sent only to Anthropic; it is never saved into any file you export or share.
The software is free. The API calls are not, but they are cheap: a full run on 29 stories, including criteria generation, scoring, a reliability check and six queries, came to around half a dollar.
Bring a CSV or TSV with one text per row and two columns , a short label and the full text, or a folder of plain text files.
Contents that you can work with
- Abstracts from conference proceedings or downloaded published papers
- Chapters of a book, written by different authors but around the same common subject
- Most Significant Change stories
- Case studies
- ParEvo exercise storylines
- Project proposals
- Progress reports
- etc…
Texts should have a common structure but variable content
What you get out
Everything is exportable, in formats other tools can read.
- Matrix (CSV): the difference criteria, the binary scores on those criteria, cluster assignments, and a provenance block recording every parameter, prompt and cost. Feeds directly into EvalC3 for predictive modelling.
- Dendrogram (GraphML or PNG): GraphML opens in Gephi, yEd, Cytoscape or igraph, with every node carrying its distinguishing criteria. PNG carries branch labels so a written report can refer to branches by name.
- Provenance and cost report (PDF): how this was made: parameters, criteria, prompts, reliability results, tokens and cost by phase.
- Findings report (PDF): what was found: the dendrogram as centrepiece, each branch explained by what distinguishes it, your query findings attached to the cut height they were run at.
- Session (JSON): the whole state. Reload it to resume, or send it to a colleague who can open it in the same tool and see exactly what you saw.
A worked example
The corpus: In my 1998 PhD thesis on organisational learning, Chapter 8 describes the first large scale implementation of what was to become known as the Most Significant Change MSC) technique, by CCDB, in Rajshahi district of Bangladesh. It includes a detailed analysis of the first ten months of its implementation, and subsequent events.
This year, two sets of the MSC stories from months of November and December 1994 were retrieved from an archive and imported for analysis into the Lab, via the Setup and Run tab. They describe sets of MSC stories sent by each of four participating CCDB sub-district offices, covering four domains: quality of peoples lives, peoples participation, sustainability of peoples institutions and activities, and “any other changes” Twenty nine in all (3 were missing).
The Set Up and Run settings
-
- The corpus context— what kind of texts are these? : “These are “Most Significant Change” (MSC) stories collected by CCBD field office staff in four sub-districts of Rajshahi District, Bangladesh, in late 1994. They describe events in the lives of the communities CCDB was working with in those sub-districts.”
- Criteria focus — what kind of difference should the criteria target?: Identify the most signficant difference in the outcomes described in these stories.
- Target number of criteria: 10
- Sample size for criteria identification: 29
The identified criteria
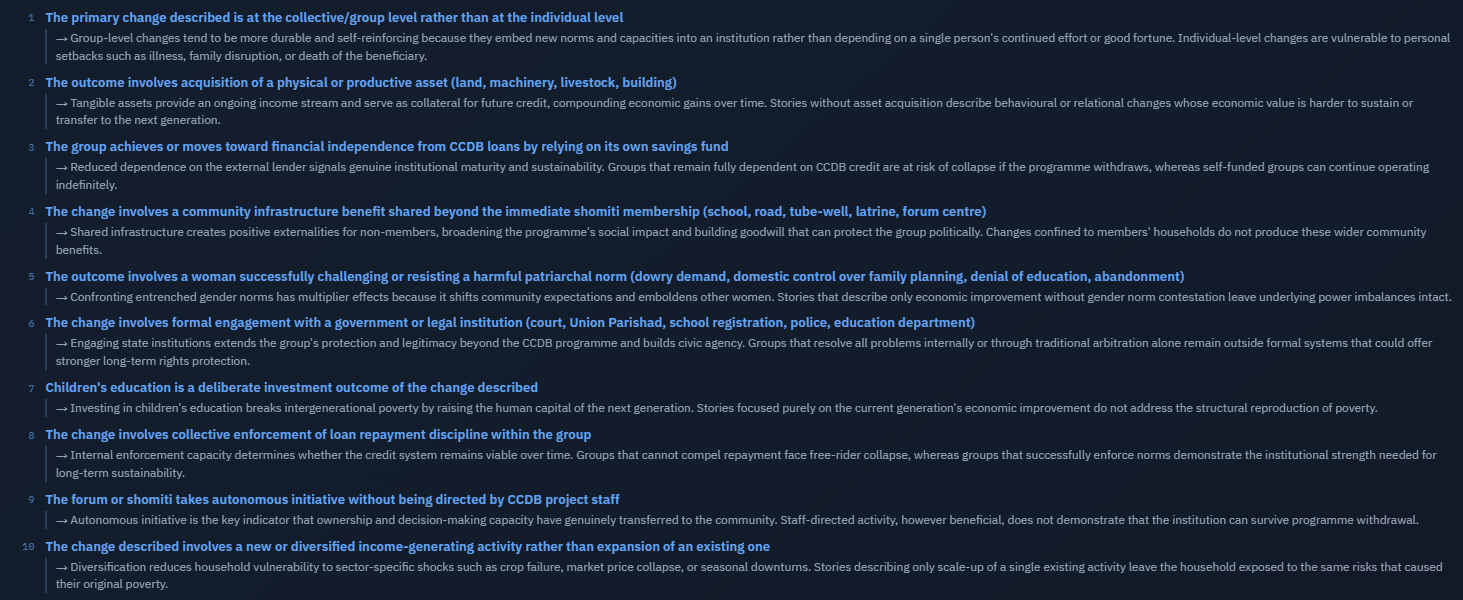
The dendrogram
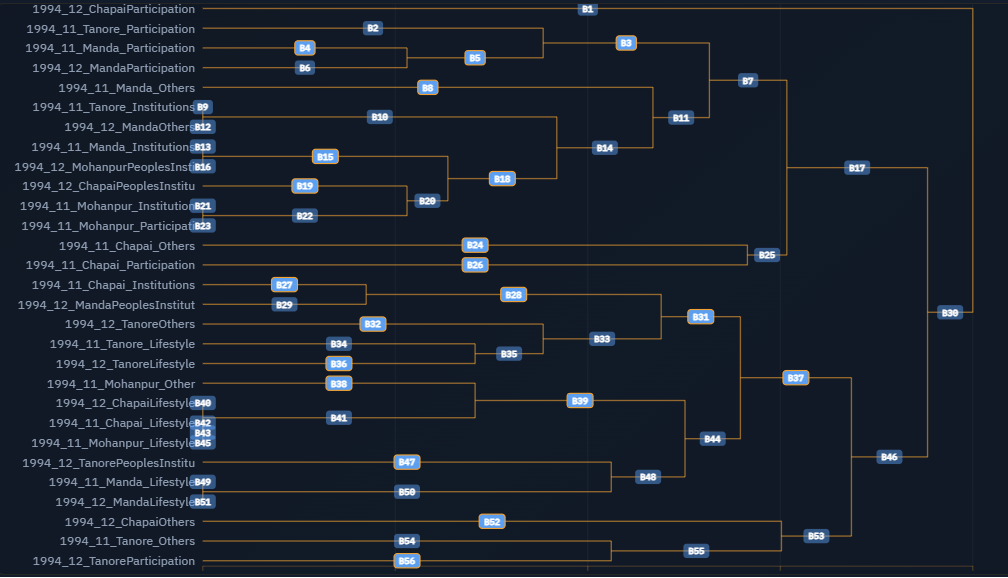
A dendrogram of 29 Most Significant Change stories; story labels run down the left, horizontal lines join the most similar stories into progressively larger groups towards the right, and a numbered badge at each junction links to a description of how that group differs from its sibling.
The Query function: An example use
CCDB’s Bangladesh programme collected Most Significant Change stories through 1994, and an HQ panel in Dhaka selected the most significant from each month. I gave the Lab 29 of those stories and asked it to predict which two the HQ panel had chosen from the seven stories about people’s participation.
It got both wrong. It picked a Forum hosting a donor visit and a woman winning a court case against her police-officer husband. The panel had picked two stories about loan default.
But this turned out to be a useful result. Asked to reconstruct the reasoning behind the choices made by the panel and itsef, the Lab produced an account of two quite different ideas of what makes a change significant — and the differences between them are informative. Read more about this here
Where this sits methodologically
The Lab is an interpretable clustering method of the kind sometimes called pre-clustering: features are made human-readable before clustering, and the groupings are computed from them.
A survey of interpretable clustering divides the field into three families — methods that make the features readable before clustering, methods that build interpretability into the algorithm, and methods that fit explanations to black-box results afterwards. The Lab belongs to the first.
That survey also names two properties of a good interpretable method: parsimony, meaning the fewest features needed to define each group; and uniqueness, so that the same evidence points to one group rather than being ambiguously shared. Both properties can be explored via the Selection tab, which can be used to find the smallest criteria set that effectively disaggregates the set of texts.
For a wider view of clustering methods available to evaluators, quantitative and participatory alike, see Cluster analysis for evaluation.
Reviews by other LLM AI models
- By Gemini (2026 09 05)
- By Chat GPT (2026 09 05)
Cautions
- Criteria that divide are not always criteria that matter. Choosing the frame narrows what is looked for; it does not settle what is found. A criterion can split your set neatly while separating texts on something incidental. Read them before you use them to cluster. The tick boxes in the Reliability and Cluster tabs let you drop one and see the tree recompute without it, instantly and at no cost; the Selection tab is for building a curated set properly and re-scoring.
- Scoring is not deterministic. Run the reliability check. A criterion that scores differently across multiple passes should not be carrying weight in your tree.
- Different framings give different trees, deliberately. Running the same texts under a different criteria focus will produce a different structure. This is a feature: what stays stable across framings is more trustworthy than what appears under only one.
- The Query tab reads the texts, not the scores. Answers there come from the model reading your documents, not from the matrix. Questions about the scores themselves — which two texts overlap least, say — belong to the matrix and the dendrogram, not the dialogue.
- It is not a substitute for reading. It is a way of deciding what to read closely, and of making an argument about structure that someone else can check.
Earlier versions
Every published version stays at its own address permanently, so links and citations continue to resolve. If you have cited a specific version, that link will keep working.
Feedback
Feel free to contact me if you are having any problems with the app, or ar not sure how to use it:
rick.davies@gmail.com
I am particularly interested in hearing from anyone who has run this on their own corpus. Especially where the groupings did not match what you expected, since that is where the method is most informative and most in need of testing.
