Update December 2014: This page is now a subsidiary section of the page on Predictive Models
Purpose: Prediction Matrices are for building and testing complex predictions
Suitability: Where interventions take place in multiple settings in parallel; where there is some variation in the ways those interventions are implemented across the different settings; and where there is some variation in the nature of local settings where the interventions take place. For example, a maternal health improvement project implemented by District Health Offices in different districts across Indonesia
The core idea: A useful prediction about large scale changes can be built up out of many small micro-judgements, using relative rather than absolute judgements
Caveat Emptor: This method was developed for use in Indonesia a few years ago, but never tested out in practice
Introduction
The Prediction Matrix is a relatively simple tool for developing and testing predictions of how different events are expected to lead to a particular outcome. This can be useful at two points in time
- When retrospectively trying to assess how much various project activities have already contributed to a known outcome
- When planning a package of activities that are expected to contribute to a desired outcome (which has a specific target)
The Prediction Matrix does this by developing a model of how a project works. This can then be used to generate a predicted outcome, which can then be compared to a known (or planned) outcome. If the predicted outcome fits the known outcome, the model can be said to be working, because it fits well with reality. If it does not fit well, then this signals to us that we have to revise our thinking about what causes the outcomes. This will have implications for evaluation findings (if used retrospectively) and the contents of plans for future activities (if used prospectively)
The Prediction Matrix has its limitations, which will be described. But it does have some advantages over some other simpler alternatives, such as a one-to-one cross-tabulation between an expected cause (present and absent) and a known outcome (present and absent). The problem with simple cross tabulations is that they leave out the possibility that the outcome may be the result of multiple causes, including causes a project has no control over.
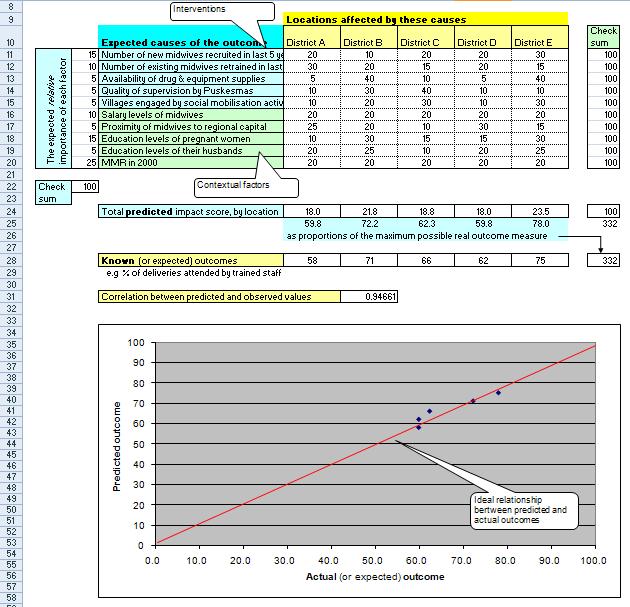
The Prediction Matrix can be produced using Excel, projected onto a screen in a workshop setting. An example matrix format is shown below. It should be referred to, step by step, when reading instructions below on how to construct a model, and its predictions about outcomes.
Process for constructing the model
1. Identify the outcome that is of interest. For example, in the IMHEI project in Indonesa, this was the percentage of deliveries assisted by trained health staff. This was recognised as a proxy measure of improved maternal health.
2. Identify the locations where data is available on this outcome. Many locations are better than few. So if data is available at district as well as province level, break it down to district level. In the IMHEI project this data was available for four provinces.
• List the locations in row 10 (insert more if needed)
• Insert the data on known outcomes, for each of these locations in row 28
NB: If the Prediction Matrix is being used for planning purposes, the outcome data could be the levels of coverage (in % terms) expected by the end of the plan period
3. Identify the potential causes of differences these outcomes across the districts, including those causes the project can influence and others it cant influence
• List these in column labelled “Expected causes of the outcome“, in rows 11 to 20 (and add more rows if needed)
• Convert any negatively stated causes into positives E.g. from “geographic isolation”, to “proximity to regional capital”. So that all causes have the same direction of influence (i.e. helping to improve maternal health)
4. You may recognise that not all causes are equally important. Some might be expected to have a much bigger overall effect than others. You can build this view in to the model by allocating 100 “cause” points down the column on the left of the list of causes. Place many points in row for the cause you think will have a big overall effect, across the project as a whole. Place few points in the row for the cause you will have a relatively small overall impact, across the project as a whole. Make sure all listed causes have some points, or remove the cause that you don’t want to give any points to. Make sure all the points allocated add up to 100 (look at the Check Sum row at the bottom, row 22)
5. Now look at each cause, in turn. Look across the locations in the same row and identify where it is expected to have a big effect, a small effect, or no effect at all. Use 100 “cause” points to indicate where the effects are expected to be. Place many points in the location cell where a big effect is expected. Place few points where a little effect is expected; place no points where no effect is expected. Place equal points in all cells, if the effect is expected to be equal in all locations. But make sure the total number of points in the row = 100 (see Check Sum column on the far right).
6. When assigning points to each cause in each location, make use of all available and relevant information (statistics, reports, staff observations) that has any merit. It may be useful to make a note of which of these sources were used. Use the Right Click>Inert Comment function in Excel to record these for any cell
7. Go through the same process again, with each of the other each expected causes, working your way down each of the rows of causes.
8. As you do this, a cumulative point score will appear in row 24, for each location. The cells values will signify the predicted relative impact of all the causes on each location. Each cell value here = the sum of (the value in each “district” cell above (created in step 5), multiplied by the % “cause” points you have already given to the cause in that row (created in step 4)). You can see the exact formula in this Excel file, by placing the cursor on one of the row 24 cells
9. Look at the graph that is shown below the matrix. The graph shows the relationship between two sets of figures in the model
• The predicted impact scores in row 25
• The known outcomes, in row 28
10. Also shown below in row 31, is a correlation figure, showing how well these two sets of figure correlate with each other 0.99 is a very high correlation, 0.11 is a very low correlation. I should state here that the example shown here is an imagined one. In practice a correlation of 0.94 is probably very unlikely.
11. If the two sets of figures are highly correlated, the model is fitting well with reality. If there is a weak or non-existent correlation, it has a poor fit
12. If the model does not fit with reality, then the cell values and the weightings of each cause can be changed, to produce a better fit. BUT this should be done carefully. In principle the choice of all cell values (which are the participant’s judgements) need to be accountable. That is, it should be possible to explain to non-participants why those values have been chosen, when compared to others in the same row. This is where the inserted evidence comments, mentioned above, will be useful.
Suggestion: When collecting the micro-judgements on the “cause” points to be allocated across the causes (step 4) and across the locations (step 5 – 7) it would be best to obscure rows 24 and below, to prevent any emerging macro level trends from influencing the micro-judgements. Rows 24 and below could be revealed when all micro-judgements have been completed.
Commentary on the method
The Prediction Matrix is making use of subjective judgements and interpretations, but at the price of requiring those judgements to be transparent and accountable. So, if cell values are changed, to improve the fit of the model with reality, then the reasons for those changes need to be clearly explained.
Behind the design of the Prediction Matrix are some important assumptions:
Two assumptions are related to large scale programs:
1. In large scale programs most outcomes of concern have multiple causes
2. The combination of causes that leads to a specific outcome is often context specific. They vary location to location
Two assumptions relate to how to build good models:
1. The more detailed a model is, the more vulnerable it is to disproof. Vulnerability to disproof is desirable, over time it should lead to improvement in the model. The models produced by the Prediction Matrix has two dimensions of detail:
• The number of causes (more are better)
• The number of locations where those causes may be present (more are better)
2. The more transparent a model is, the more vulnerable it is to disproof. Two aspects of the Prediction Matrix are transparent:
• The importance weightings given to each cause
• The relative impact weightings given in each location
What is not yet transparent in the Excel version of the Prediction Matrix, but which could be (via inserted Comments) are:
• The reasons given for different weightings to the causes
• The reasons given for different impact weightings
The limitations of the Prediction Matrix are:
• Explanations given for different cell values may not be based on very clear or substantial arguments and evidence
o This means that choices of cell values should be discussed and debated as much as possible, and well documented. And then exposed to external scrutiny. This is why it best to develop the Prediction Matrix in a workshop setting.
• A good fit between predicted and actual outcomes could be achieved by more than one set of cell values in the matrix. There may be more than one “solution”
o If this is found to be the case, in a particular real life application, then the important question is which of these sets of cell values can be best explained by the available evidence and argument.
When assessing the value of the Prediction Matrix it should be compared to other tools available or usable in the same context for the same purpose, not against an ideal standard that no one can meet.
Relationship to other methods
1. Realist Evaluation
The structure of a Prediction Matrix can be related to Pawson and Tilley’s concept of Context-Mechanism-Outcome configurations, in their school of Realist Evaluation. The Contexts are the district locations and values given in their cells to what could be called the mediating variables listed in rows 16 to 20. The Mechanism are the interventions (independent variables) listed in rows 11 to 15, and the values given to their cells in each location. The expected Outcome is in row 24.
When I shared a description of the Prediction Matrix with Nick Tilley in 2006 he commented: “ I enjoyed this. It looks a useful tool. I like the corrigibility [i.e ability to be adjusted and improved]. I can see the fit with what david and I were saying.On a realist front I guess what might emerge are not underlying causal mechanisms but flags for them.”
2. Qualitative Comparative Analysis (QCA)
This family of methods was developed by Charles Ragin. This method also involves looking a relatively small number of cases and how differences in their attributes relate to differences in observed outcomes. In contrast to the Prediction Matrix QCA matrices simply indicate the presence or absence of an attribute (via a 0 or 1), not its relative importance (via the ranking value). And instead of showing all locations as seperate entries, locations or incidences which have the same attributes are collapsed into one entry, with an additional attribute describing its frequency of occurence. The process of then identifying the relationship between these different configurations and the presence/absence of the observed outcomes also differs. Through a process of comparison, facilitated by software, one or more combinations of attributes are found which can predict the observed outcomes.
PS: In Using Qualitative Comparative Analysis – (QCA) and Fuzzy Sets. Peer C. Fiss says “QCA is not useful in very small-N situations (e.g. less than 12 cases)” These are the circumstances where ranking is possible. Wendy Olsen says QCA is best for cases between 9 and 200
PS: Fuzzy Set QCA allows cases to have a degree of an attribute, not just an attribute or not.

