for representing project contexts, plans and outcomes
Contents: | 1. The purpose of this webpage [2] | 2. Where are network models …useful… [3] | 3. What is a network? [4] | 4. Examples of networks… [5] | 5. Ways of representing networks [6] | 6. Describing relationships… [7] | 7. Sources of data [8] | 8. Evaluating relationships… [9] | 9. Structural features of networks [10] | 10. Participatory approaches… [11] | 11. Dynamic network models [12]| 12. Relationship to systems thinking. [13] | 13. Useful Software [14] | 14. Application examples [15] | Related resources [16] |
See also a related post: The Social Framework as an alternative to the Logical Framework [17]. Network diagrams are useful visual tools for mapping and modelling the complex contexts in which many development activities take place. The Social Framework is a separate but complimentary tool, for providing a summary textual description of project intentions within that context, but in an alternate form to the Logical Framework
Please note: this page is still under re-construction. It was last updated on 21 June 2008. The pre-2008 version can be found here [18]. This is part of a larger section of the pre-2008 website called Networks and Evaluation [19]
1. The purpose of this webpage
…is to explain how network models can be used to describe development projects. Descriptions can be useful for documenting an intended set of activities and outcomes, and for documenting the actual activities and the outcomes that eventuate. An evaluation will normally need to develop and compare both types of description.
There is a background assumption being made here: that better descriptions of planned and actual developments will make it easier to implement these developments, and to evaluate them. Consider an extreme negative example of this proposition: what would be the consequences if the contents of all project proposals had to be communicated by mime?
There are some related webpages that are relevant:
- Network perspective on development projects: More than a metaphor [20]. A 2004 conference paper by Rick Davies. This provides an overview of why network perspective is relevant, and some of the wider implications of taking a network perspective
- Social Network Analysis and Evaluation: [21] A list of documents available on line
- Working with the Logical Framework [22], a section of the MandE NEWS website.
And a relevant quotation: “At the heart of all major discoveries in the physical sciences is the discovery of novel methods of representation” Steven Toulmin [23]
2. Where are network models likely to be a useful means of description?
Network models are likely to be useful in any of the following kinds of settings:
- Where there are many actors (people and / or organisations) who are fairly autonomous and where there is no central authority.
- In large projects with many stakeholders, rather than small projects with few, where a single authority is less likely to be found.
- In projects where there is no single objective, but many alternative and/or competing objectives.
- In projects deliberately designed to function as networks (called “named networks”, in this paper).
Network models can also be useful as a means of describing projects that are more “traditional”, where there is a single agreed objective, clear lines of authority, clearly differentiated responsibilities, and which can be describe by a temporal logical model (e.g. a Logical Framework). Here network models can provide supplementary detail that cannot be easily represented otherwise. For example, the relationships between multiple Activities and multiple Outputs, or multiple Outputs and multiple Purposes (outcomes).
3. What is a network?
A network is a collection of people and / or things that are connected to each other by some kind of relationship. Many kinds of entities can be part of a network: people, projects, documents, events, organisations, cities, countries, etc. And there are many kinds of relationships that can link such entities, involving transmission or exchange of information, money, goods, affection, influence, infection, etc.
Note: Within this definition, named networks are part of a much larger set of networks. A network does not need to be labelled or formally named as a network to be a network.
Note: Because this webpage is concerned with the use of network models for planning and evaluation purposes the focus will be on networks of actors, objects and events that are observable. That can be interviewed or that can be read about. So network models of more abstract processes will not be discussed here.
In the narrowest sense, network analysis [24] is the analysis of the structure of relationships within a network. A wider and more useful view also considers the attributes of the members of a network.
The tools used for network analysis come from a field of social science known as Social Network Analysis [25] (SNA). SNA is especially relevant to the development of network models of development aid programs, because development aid is about people and their institutions. SNA is the main intellectual influence on the contents of this webpage, and the other related papers mentioned above. Network analysis is also used in the study of biological systems, physical systems and economies, but those usages are not discussed here.
4. Examples of networks that can be seen in development projects
- A network of international donors supporting various NGOs within a particular country
- A network of NGOs within that country, who have contact with each other, work with each other and who may also compete with each other
- Within an NGO, a network of staff, who are connected formally and informally
- Within an NGO, a network of activities which form different kinds of business processes, that generate different types of services. Such as workshops, training events and email newsletters
- A network of community organisations (formal and informal, modern and traditional) linked by overlapping membership, or by authority relationships.
- A network of enterprises, lined by their commercial relationships, forming supply chains and networks within a specific industry.
- A network of families linked by kinship
- A network of donors and NGOs linked by common policy concerns, such as specific objectives within a national poverty reduction strategy
- A network of policy documents, linked by overlapping sets of indicators of achievement.
- A network of events, such as workshops, linked by overlapping sets of participants
5. Ways of representing networks: diagrams, matrices and measures
In Social Network Analysis (SNA) a network can be described using three types of tools, which are related:
- As a matrix, which can be converted into…
- A network diagram, and
- Mathematical measures, which can be used to describe…
- The overall structure of a network, and
- The position of individual actors in that network
The focus in this paper will be mainly on matrices and network diagrams.
The network matrix shown below documents the existence of relationships between a set of 16 NGOs in Ghana. Each cells value tells us the number of times a specific relationship was mentioned in an NGO report. Note that the convention with such matrices is that the cell entries always show the relationship that exist from the row actor to the column actor. In other words, how often the row actor mentioned some form of relationship with the column actor, in their report. As will be shown below, there are many other aspects of relationships that can be shown, other than simply whether the relationship exists or not.
 [26] [26] |
 [27] [27] |
Click on each image to get a full-screen version in a new window.
Click again to get better resolution with the network diagram |
A network matrix can be converted into a diagram, and vice versa. In the network diagram above we can see aspects of the network structure which are not readily visible in the matrix description of the same network. There is a cluster of NGOs on the left, where all the NGOs are linked to each other. In the top left corner there are some isolated NGOs, not linked in to the network, and there are some NGOs that are quite central, having many connections (e.g. WILDAF and ABANTU).
There are two types of networks that can be shown in matrices: one mode and two mode networks. In a one-mode network the list of actors down the left side (in the rows) are the same as those listed across the top (in the columns). The NGOs x NGOs matrix above is a one-mode network. In a two-mode network the row and column entities are of a different kind. For example, the rows may list NGOs and the columns may list different government policies that the NGOs are engaging with (See this Ghana example, [28] pages 11-14).
6. Describing relationships within a network matrix or network diagram
The network shown above has a very simple description of the relationships involved. The matrix cell values simply state how often a relationship has been referred to. For the purpose of project planning and evaluation a more detailed description would be needed. In Social Network Analysis cells in a matrix can be used to describe many different aspects of relationships:
- Existence of a relationship: Described by using a 1 or 0 in a matrix (as above), or the presence or absence of a link in a network diagram
- Type of relationship: Described by using numbers, such as 1, 2, 3,… to represent different categories of relationships, that have already been identified as of interest.
- Frequency of interaction: Described by using numbers to indicate frequency per period or in total. Or by indicating the relative proportion of an actor’s time spent on each relationship.
- Value of the relationship: Described by using numbers to signify a rating or ranking of the relative value or priority of different relationships
- Sequence of the relationships: Described by using numbers (e.g. 1, 2, 3) to representing a sequence of events over time, or dates representing actual times
- Details of a relationship: In small matrices the cells can contain text descriptions of the relationship
The same information can be represented in network diagrams by using the colour, size and line type to code the type of links that exist between specific actors (as described in the matrix). Similarly the colour size and shape of nodes in networks can be used to code actor’s attributes.
The choice of what kinds of actors, and what kinds of relationships between them, should be captured in a network description is a matter of choice. This choice should be informed by one’s theory or views, of what is most important about the network being described.
7. Sources of data available for describing networks
- Applications (both existing formats and those designed specifically to collect network data)
- By organisations seeking funding (application forms). Applicants may be linked by other donors, and by other organisations they work with in different forms of partnership (govt, NGO and others)
- By individuals seeking employment (CV/ Resumes). Applicants may be linked by previous projects, employers, and referees.
- Records of participation: People and organisations may be linked via their participation in various project “outputs”: workshops, training events, mailing lists, websites, etc. This kind of data is often held in databases.
- Reports / documents:
- Documents and authors may be associated in lists of references
- Different kinds of objectives, associated with different strategies and activities, may be linked in tables intended to show such relationships
- Tables of detailed data provided in annexes may show many other kinds of inter-relationships
- Content analyses of the text of reports can identify how often different relationships with others are mentioned.
- Online sources
- Website statistics. These can show relationships between pages (connected by numbers of people moving between them, in either direction). See Google Analytics [29]
- Google searches: These can show relationships between two entities (website addresses, people, documents) connected by the number of pages make reference to both of them. See how www.mande.co.uk relates to 13 other websites [30]
- Special purpose surveys
- Household surveys can include questions about “who do you go to when you need (x form of help)?
- Surveys of workshop participants [31] can ask about relationships amongst participants at the beginning and end of a workshop.
- Online surveys can be used to seek, and make available, data on different groups, including email list members [32] and others not associated with such groups [33].
8. Evaluating networks
Evaluators’ attention can be directed towards:
- The nature of the relationship between two actors. Such as between a donor and grantee. This is often the focus of reviews of aid agencies’ partnerships.
- The composition of the portfolio of relationships one actor may have with others. For example a given donor may have a portfolio of relationships with various grantees, all of which are addressing HIV/AIDS issues, but in different ways. The donor’s medium term strategy may be to change the composition of this portfolio, to work with more of one type, and less with of another. Hierarchical Card Sorting [34] is a useful tool for making these strategies more explicit and open to review.
- The structure of relationships between a set of actors. Such as between the grantees of a donor, or amongst the donors themselves, or amongst actors in larger and more complex networks. This sort of evaluation is uncommon but very relevant to improving the systemic effectiveness of aid agencies. The next section looks in detail at the kinds of structural features of networks that can be examined.
- One or more pathways through a network. For example, how clients should and do move through complex networks of service providers in the social and and health services sector in the UK. In aid programs the focus of attention is more likely to be on the flow of funding and information and influence, which might link the donor activities with changes in government policies and then changes in the lives of poor communities.
- A planning tool, called the Social Framework [35], has been developed to help document and monitor expected changes in a pathway of relationships through a wider network. This is an adaptation of the Logical Framework [22], which has been widely used to develop logic models of development projects.
9. Structural features of networks.
The structure of networks needs both description and interpretation. This because while it is true that there are various structural features that can be found in many networks, the meaning of these features is typically highly context specific, depending on who is being asked, and where they fit within or outside the network we are talking about.
Seeking stakeholders interpretations of the significance of network structures will be easier, if we can talk in more specific terms about network structures The structure of networks can be described in a variety of ways. Some of these are straightforward and easy to understand. Others involve some complex mathematics, and won’t be discussed here. Interpretation will be discussed in further below.
Although there are many different terms used to describe the structure of networks these can be broadly categorised as follows;
- Terms describing the position of individuals within networks (see the diagram below)
- How central or peripheral they are E.g.
-
- Degree Centrality = number of links an actor has with others
- In-Degree and Out-Degree = number of inward and outward links to other actors
- Betweenness = extent to which an actor is situated between two groups, and is a necessary route between those groups
- Closeness = the average distance between an actor and all other actors in the network.
- How similar one actor’s position is to others. E.g.
- Reciprocity = two actors reporting the same kind of relationship with each other
- Structural equivalence = two actors have the same structure of relationships with other actors in the same network
- Terms describing the structure of the whole network
- The size of the network, = number of members
- The existence of components = multiple smaller networks not linked to each other
- The density of the network linkages = number of linkages as percentage of those possible in a given network
- Cohesion = the average distance between two members of a network
- Clusters = a group of actors with more inter-connections between each other, than with others surrounding them
- Cliques = a group of actors totally connected to each other. All possible connections exist.
For more detailed information on each of these, and other types of features, go to Robert A. Hanneman and Mark Riddle’s online “Introduction to social network methods [36]”
A summary, using Krackhardt’s [37] Kite [37] network example
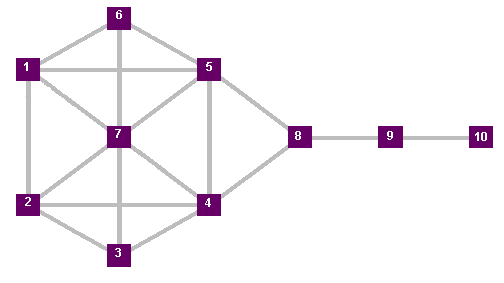 [38]
[38]
 [39]
[39]
Node 7 has the highest Degree Centrality
Node 8 has the highest Betweenness Centrality
Nodes 4 and 5 have the highest Closeness Centrality
Node 10 is the most peripheral, having the least connections of all
Nodes 4 and 5 are “structurally equivalent”
Don’t forget the actors themselves. An exclusive focus on structure of relationships within networks runs the risk of ignoring an equally important dimension of networks: the members and their attributes. Stakeholders in a network may be just as concerned with the overall membership of the network as with any structural features of the relationships between them. Similarly, with the contents of their relationships. It is no simply the existence of relationships but the kinds of relationships that will matter to stakeholders. These two basic elements that make up the structure of networks can easily be lost sight of.
10. Participatory approaches to network analysis
Because quantitative social network data is increasingly amenable to the use of social network analysis software there is a risk that analysis of networks will be reduced to a 21st century version of “number crunching”. If the data is there, and the software is there, why not crunch the numbers?
The answer is that this will only take us so far. Analysis needs to be informed by a theory of what is supposed to be happening. While our own theories may be interesting and relevant, the theories of the actual participants in these networks will probably be even more so. This is especially the case in development projects, where there will usually be some intention to seek change in the behaviour of at least some of the actors in the network.
Social network analysis has come from an academic background, so there is still plenty of room for innovation relating to practical applications. Especially in participatory approaches to the description, analysis and planning of networks.
Options
People can be involved in network analysis at all stages of a project’s development:
- Baseline collection of data about relevant networks
- Analysis of that data
- Identifying changes that are needed
- Implementation of changes
- Monitoring and evaluation of changes
People can participate in different ways, via the use of various tools:
- Individually, by being survey respondents and providing data on their place in networks of interest. This is the most limited form of participation, but the most widely used. In situations where members of a network of interest are in conflict, or do not see any common interest, it may be impossible and / or unwise to bring them together in a workshop setting. In some cases data can be collected via one to one interviews, but fed back collectively, when participants are interested to see the wider picture that will be provided.
- Collectively, by providing, discussing and analysing data in one setting:
- In workshops network diagrams can be developed live, by projecting network analysis programs like Visualyser [40] onto large screens and inviting participants to identify which actors are linked to which, and in what ways. Discussions can be about both actual and desired structures.
- Alternately, blank actor x actor matrices can be projected onto screens using Excel, and participants can be asked to list the relevant actors, then fill in cells values describing the kind of relationships between these actors that are of interest. Summary rows and columns can be used to automatically aggregate data about each actors links to and from others.
- In outdoor situations Venn diagrams can be drawn on the ground, in a small group setting, to capture relationships between groups of people. Venn diagrams are only useful to describe small networks.
- Eva Schiffer [41] has developed a physical toolkit for network mapping and discussion in small groups. This method can be used to describe larger networks than those covered by Venn diagrams.
- Dynamically, by involving people in what are called “social simulations” of networks, whereby they take the part of a given actor (person, organisation or group) in a network, and make a relationship with another in that network, to pursue an objective. This process is then repeated over a number of iterations, or generations, allowing people’s subsequent choices to be informed by their knowledge of the choices made by other actors in the previous iteration.
The role of specialist facilitators: Some suggestions
- Differentiate Mapping from Navigating. External specialists / facilitators can help map the territory (i.e. the networks of interest). But the actors in that network need to do the navigating, deciding where they need to go: what sort of relationships to develop, change or end. Facilitators can help by pointing to structural features of the network (as in see section 9 above) and asking if and how they need to change. They can also help by feeding back the aggregate consequences of these decisions by individual members. Spreadsheets with summary rows and columns are one simple way of providing this aggregate feedback. Or, if network diagrams are projected on the screen any changed links can be drawn on the screen as they are proposed.
- Predict, test, discuss: Asking people to predict the aggregate results of an earlier survey or workshop exercise, before they are shown the results, is a very effective way of engaging people in discussion and analysis of these results. Using a matrix participants can be asked to predict relative values in the summary rows or summary columns. Using a network diagram with actors names removed they can be asked who they think occupies various positions shown in that diagram. Then they can be shown the actual results in the matrix or network diagram. The bigger the gap between participants’ predictions and the actual observed results the more likely it will be that this process will be adding value, by improving participants’ (and facilitators’) understanding of what is going on. Discussions about the gap are likely to focus on two important issues: (a) The method used (was it at fault, was it better than previous methods?) and (b) on the reality being observed (why does it look like this, when we thought it was like that?).
11. Dynamic network models
Network structures change over time, and so do the attributes of the actors and relationships within those networks. It can be useful to try to map or model these changes. One simple means is to treat separate network diagrams as slides in a rapidly moving slideshow, describing changes in the structure of a given network over time. Some software like Visualyzer [42] allows series of network diagrams to be replayed like this. Even the “View as a Slideshow” option in Windows can be used for this purpose, if network diagrams are saved as image files.
- PS: Within a network dataset it maybe that specific relationships took place during specific time periods. Those time periods can be recorded as attributes of the relationships concerned. The network structure can then be filtered using those attributes to show only those relationships present during a specific period
The NodeXL template for Excel provides another means, this time for describing changes in the attributes of actors and relationships within a given network structure. If actors are each given a numerical value (on some attribute of interest), and the same is done with each of the relationships between them, formula can be inserted in a NodeXL worksheet that will generate new values for the actors in the next time period, depending of how each actor is connected to the others in the prior period. This process can be reiterated through any number of time periods, creating a series of new values. Because of the complexity of some networks, the final values that are produced through this iterated process may not be easily predictable at the first glance of a network structure. A very simple imagined example in Excel is available here [43]. (NB: NodeXL [44] needs to be installed and used within with MS Excel 2007). PS: Click on Show Graph in left panel, to make the network structure visible.
12. Relationship to systems thinking
In Systems Thinking and Capacity Development in the International Arena (in Beyond Logframe; Using Systems Concepts in Evaluation [45], 2010) Bob Williams has written on what he sees as three core systems concepts: Relationships, Perspectives and Boundaries. The first of these is the oldest idea, and one which Bob describes as being the “wiring diagram stage” of thinking systematically. In discussing this core concept he introduces two methods that highlight inter-relationships: “Systems dynamics” and “Viable systems modelling”. Somewhat to my surprise he makes no mention of social network analysis as a method. Yet, as far as I can see there is no other set of methods for describing inter-relationships that has been so extensively developed and so widely used.
The second core concept is Perspectives. This emphasises the fact that the relative importance of particular inter-relationships depends on the different purposes you can ascribe to any single situation.This is an important point, which I try to make by saying to people that how you read a network depends on your “theory of change”, what you think should be happening. It is important to help people articulate their expectations when viewing networks, as part of a process of learning, both about differences in views with others looking at the same network, and about differences between what was planned and what actually happened. Perspectives are also important when using social network analysis visualisation software. Almost all versions of social network analysis software enable you to filter out specific kinds of actors and specific kinds of relationships, in order to focus in on what you think is most important. This is a very valuable feature of the software, you are not just given one static view. But it also requires that you think about the different perspectives you are looking for, and why so. Random searching amongst different perspectives (i.e. different combinations of actor and relationship attributes) will waste large amounts of time. Searching informed by a prior idea of what is important helps enormously.
The third core concept is Boundaries. In some ways this is an extension of the perspectives concept. This is about being clear what has been left out of the network, by whose decision and why so. The choices made about network boundaries affects the whole range of perspectives that can be taken on what is included in a network. Very few networks have natural boundaries that are easily identifiable and agreed upon by different observers. yet, for practical purposes decisions need to be made about what is to be included and what is left out. At a minimum, those decisions need to be transparent, to all those viewing and using the networks then described. A more ambitious approach is to engage people in actively thinking about what is outside the network as described, and how they could be affecting what is happening inside the network.
PS: 3rd November 2010. Please see Richard Hummelbrunner’s extensive comment on this section, below under Comments. Robert wrote one of the chapters in the “Beyond Logframe…” book cited above.
13. Useful software
On another section of this website I have compiled a list of Social Network Analysis software packages, [46] along with some comments on those packages I have been using.
14. Application Examples: Mainly ad hoc network analyses
- (This list is way out of date and needs updating!)
- In 2004 I provided some supporting inputs into the evaluation of INASP-Health [47], as seen from a network perspective. A major activity organised by INASP-health was a series of 31 meetings on health information issues, over a period of years. One part of my analysis focused on the linkages between these meetings, and the participants who attended them. See pages 6-9 of this report [48] for more information.
- Relationships between a series of workshops organised by the Making Markets Work for the Poor [49] project in Vietnam. Potential links were created when participants from one workshop subsequently attended another. Were these emergent or planned outcomes? How important and satisfactory was the collective outcome?
- Relationships between NGOs funded by G-RAP [50] in Ghana, as mentioned in their progress reports, over an 18 month period of time
- A friend of mine has been involved in the evaluation of a bushfire safety program [51] in Australia. In the course of that work he used card sorting exercises with community groups to identify and categorise their views of the various needs that the program should address. His exercise involved participants free sorting cards, describing different needs, into as many groups as seemed appropriate by the respondents. The results were collated into a matrix of 34 needs x 34 needs, with cell values indicating how many times a given pair of cards was placed in the same group. He then used proprietary software to identify clusters of needs, that captured the aggregate views of his respondents. Later on he involved the same participants in building up a logic model based on these views. While I liked the overall approach I was not so keen on the software being used, because its methods, although systematic, were not very transparent to most people. Recently I found a copy of the matrix of data and used some free social network analysis software to convert it into a network diagram, showing what needs were associated with which, focusing on those whose associations were stronger than average. The network diagram is shown below. There are very evident cliques of needs (a clique is a maximally connected set of entities), and some larger clusters of these. When I looked at the names of the needs in each of these cliques it seemed that they were similar in topic, and related well to Gerald’s own analysis. There were also some interesting differences. I am now waiting on some comments back from Gerald. (See Dr Elsworth’s PowerPoint [52] for more information on his overall approach.)
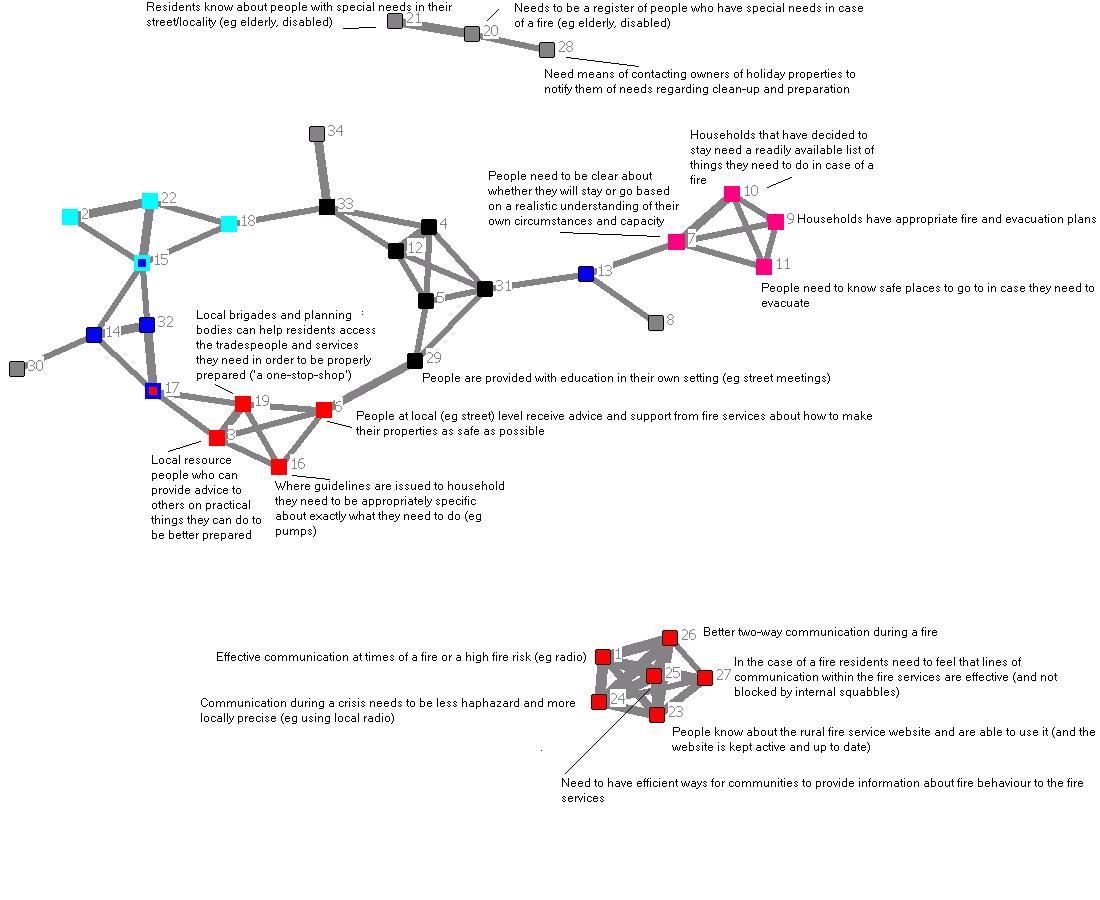 [53]
[53]
You need to click on this image to make it big enough to read, and then again to improve focus
 [54]
[54]