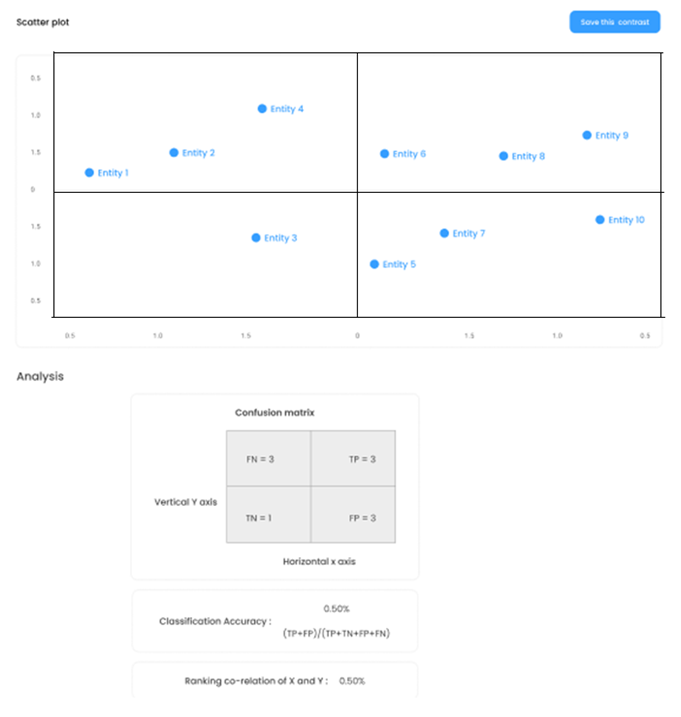
The third stage of an Ethnographic
Explorer exercise is the design and use of Contrasts.
Contrasts use pairs of rankings, presented in the form of a
scatter plot, summarised underneath by two relationship
measures. |
 |
The
contents of a scatter plot is determined by the choice of
what is to be represented by the two axes. At least three
different types of scatter plots are possible: |
| 1.
Different comparisons |
of
the same sorting
of same cases |
by
the same participant |
E.g. Expectations versus
results, costs versus benefits
|
2.
Same comparison
|
of
the same sorting
of same cases |
by different participants |
E.g. different people's views
of the same kind of priorities, preferences,
achievements, or costs
|
3.
Same comparison
|
of different sortings
of same cases |
by
the same participant |
|
E.g.
Expectations, as seen through revisited
categorisations of the same cases, at different
points in time
|
|
Analysis
stages
- Select the specific comparisons that are of interest
- Select the cut-off points on each axis, which will then
generate the Confusion Matrix
- Choose the preferred performance measures to analyse the
CM data. The default is Classification Accuracy: This
measures how well membership of one category best predicts
membership of another. For example"hard workers" and "high
achievers"
- Vary the cut-off points to identify which will enable
the best predictions of how events on the Y axis will lead
to events on the X axis
- Click on individual data points to see the configuration
of attributes of cases which are of interest e.g.
- True Positive cases, positive and negative outliers
(False Negative and False Positives)
|
|
