To submit information about conferences please use the Comment facility below or email rick@mande.co.uk
To post details of training events, or to post details about job vacancies please go to the MandE NEWS Email List
To find out more about each event, follow the link in the event description. Please do not direct your inquiries to MandE NEWS
Event Information:
-
The Basic Necessities Survey (BNS)
On this page:
2024 04 18 UPDATE: There is now a Google Groups email list for discussions about the BNS: its origins, design, modifications, uses and futures. It is member only, so pdf copies of documents can be shared. Ask for member access by emailing rick.davies@gmail.com
1. What is it?
The Basic Necessities Survey (BNS) is a method of measuring poverty that is:
- Simple to design and implement. The results are easy to analyse and to communicate to others
- Democratic in the way that it identifies what constitutes poverty and who is poor
- Rights-based, in its emphasis on entitlement
The Basic Necessities Survey (BNS) builds on and adapts earlier methods that have been used to measure poverty by measuring deprivation and which emphasise the "consensual" definition of poverty (See below). However, the BNS is innovative in the way in which respondents' survey responses are used to generate: (a) individual poverty scores and (b) a poverty line.
Basic necessities are democratically defined as those items in a survey instrument that 50% or more of respondents agree "are basic necessities that everyone should be able to have and nobody should have to go without" Items are weighted for importance according to the percentage of respondents who say an item is a basic necessity (i.e. between 50% and 100%). Respondents' poverty (BNS) scores are based on the sum of the weightings of the basic necessities they have, as a percentage of the total they could have if they had all basic necessities. The identification of a poverty line is described below.
The BNS combines two aspects of peoples lives: (a) their material conditions, (b) their perceptions of these material conditions. Both have consequences for the quality of their lives.
The BNS was developed by Rick Davies in 1997, and implemented by ActionAid Vietnam in 1997, 1998, 1999 and by the Pro Poor Centre (a Vietnamese NGO) in 2006 (See below). Its design built on earlier work by poverty researchers in the UK and Sweden (See below)
2. How does it work? The basics of the Basic Necessity Survey (BNS)
Caveat: The BNS is a survey method, but this section does not explain how to do surveys. It only explains the central part of the BNS method
At the planning stage
- Develop a menu of things, activities and services that could be considered as basic necessities.
- In the BNS, “Poverty is defined as the lack of basic necessities. Basic necessities are those things that everyone should be able to have and no one should have to go without“
- This is a rights-oriented view, focusing on perceived entitlements.
- Ideally the items to be included on this menu should be identified through consultation with a range of people, including potential survey respondents. Small group discussions may be the best means of generating potential menu items.
- Examples of things, activities and services could include: having a bicycle, going on a holiday for a week once a year, and being able to obtain vaccination for one's children at a health centre in one's district.
- The items on the menu should be easily and reliably observed, not vague or subjective, like "high self-esteem", or "a sustainable livelihood"
- They can include things, activities and services available within the respondent's community as well as being available within the respondent's house. For example, a health centre that is open seven days a week.
- The items on the menu should range from those that almost everyone might agree are basic necessities to those that few will think are basic necessities, but perhaps more people will think so in the future. For example items like a television or a mobile phone.
- In the BNS, “Poverty is defined as the lack of basic necessities. Basic necessities are those things that everyone should be able to have and no one should have to go without“
During the survey
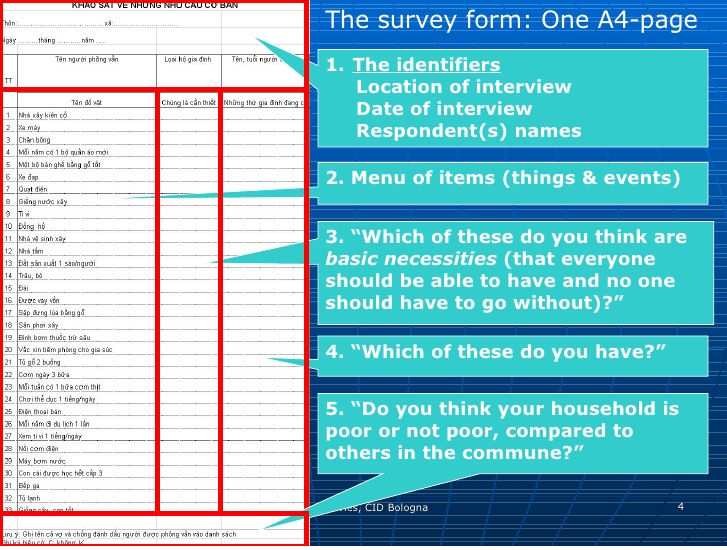
- In household survey ask people three questions
- "Which of these items do you think are basic necessities, things that everyone should be able to have and no one should have to go without“
- This can be done by reading items out one at a time, or by asking people to sort cards into two piles, with one menu item written on each card
- "Which of these items does your household have?"
- This can also be done by reading items out one at a time, or by asking people to sort cards into two piles, with one menu item written on each card
- "Compared to other people in this x area (same as area sampled), do you think your household is poor or not poor?"
- This third question is optional. It is useful because it helps to define a poverty line using the BNS survey results, but it is not essential. More on this below...
- "Which of these items do you think are basic necessities, things that everyone should be able to have and no one should have to go without“
Here is an example survey form, as used in Vietnam in 2006
After the survey
- For each item, calculate the percentage of the respondents who say that item is a basic necessity
- Exclude those items where less than 50% of people said it was a basic necessity
- This is a democratic approach. A decision by majority rule. Most people did not consider these items as basic necessities.
- For all the rest give each item a weighting, which is equal to the percentage of people who said it is a basic necessity. This percentage could range from 50% to 100%.
- Add up the weightings for all these items. This figure would represent the raw BNS score for an imagined household that had everything on the menu that has been democratically defined as a basic necessity.
- Exclude those items where less than 50% of people said it was a basic necessity
- For each actual household, add up the weightings for all the items on the menu (now defined as basic necessities) that they said they had. This is their raw BNS score
- Convert this raw score into a percentage of the maximum possible raw score (step 1.3 above)
- A household with a low percentage would have very few basic necessities, and a household with a high percentage would have most of them
- Convert this raw score into a percentage of the maximum possible raw score (step 1.3 above)
- Summarise the results
- Calculate the average BNS % score for all the surveyed households. This describes the average depth or degree of poverty.
- Make a graph showing the frequency distribution of BNS (%) scores, to visualise the distribution of poverty. Typically many will be poor in some respect (lacking a few basic necessities, and a few will be poor in many respects (lacking most basic necessities). However, the specific shape of the distribution will vary from community to community, and over time.
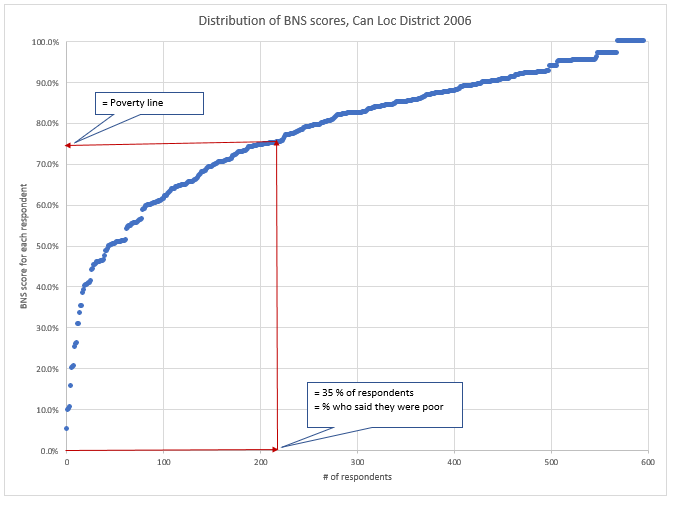
- Optional: Identify a poverty line, defined as a specific BNS (%) score. This enables a head-count measure of poverty, which can complement the depth-of-poverty measure which 3.1 and 3.2 provide.
- Identify the percentage of respondents who said they were poor, relative to others in the surveyed community of interest (we will call this x%).
- Move from the bottom of the curve describing the distribution of BNS % scores, (step 3.2 above) up to the point where now x% of the respondents are on the bottom half of the curve. Read off the BNS % score at that point. This BNS % score can now used as the poverty line. People below it are defined as poor.
- This method assumes that while individual respondents may make errors of judgement about their poverty status, these errors are equally distributed. Some "actually" poor people class themselves as not-poor, and some "actually" not-poor describe themselves as poor. There are two other assumptions that can be made about the distribution of judgement errors, which are discussed in the report on the 2006 BNS in Vietnam. The following graph uses the 2006 data.
3. Potential limitations?
-
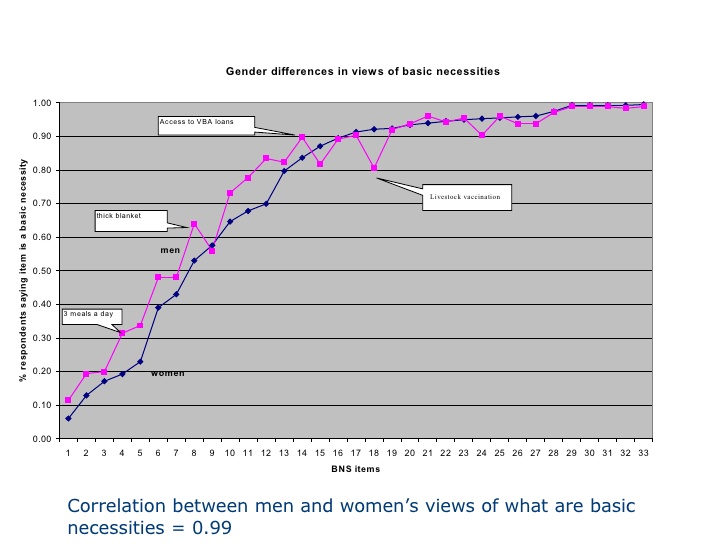
- Do different sections of the community have different views about what things are basic necessities? For example, women may have different views to men?
- High levels of agreement were found across age groups and gender in the UK. In South Africa high levels of agreement were found across age groups, gender, urban/rural, families with and without children - statistically significant correlations at level of p<0.01. See the graph below showing men versus women's judgements of basic necessities in the 2006 Vietnam (Can Loc) BNS.
- In societies without pervasive mass media, or with more fragmented and isolated communities, there might be less consensus on expectations.
- Do people's views of what are basic necessities reflect their bounded realities? If they don't know how others live, how can they have such expectations?
- In the UK the expectations of poorest respondents were not significantly different from those of the richer respondents
- In South Africa "If people were only influenced by their own circumstances then there would not be so much agreement about what the necessities in life are between the different subgroups in the population" (Wright, Noble, Magasela, 2010)
- Do people limit their view of what are necessities when they cant achieve them?
- In South Africa "Almost all respondents who lacked a socially perceived necessity said that they didn’t have it and couldn’t afford it. That is, there is very little evidence of people reporting that they had chosen not to possess any of the socially perceived necessities." (Wright, Noble, Magasela, 2010)
- Do different sections of the community have different views about what things are basic necessities? For example, women may have different views to men?
4. Further optional analyses
Please note: These are not an essential part of the BNS process. They are simply extra options for analysis of BNS data, once collected.
Measuring inequality
The BNS scores for each household can easily be sorted by size then cut and pasted into an online Gini Coefficient calculator, such as http://shlegeris.com/gini When the Vietnam 2006 BNS data were used the online calculator generated the following result:
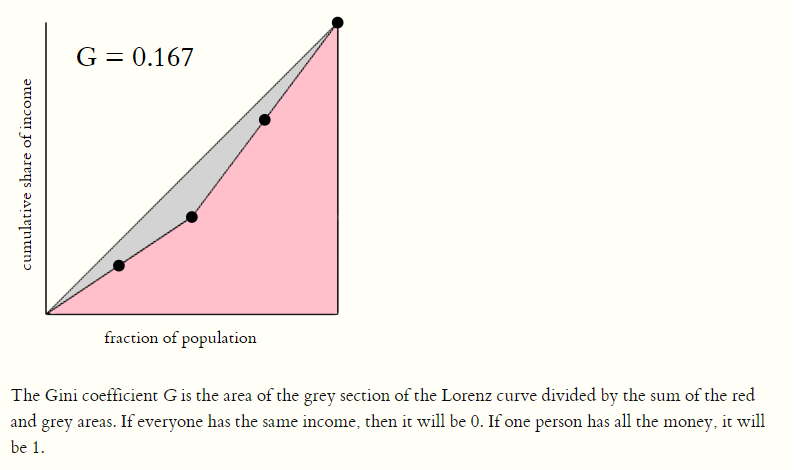
The 2006 BNS survey was of a rural community in central Vietnam. While poor by national standards there were not big differences in household wealth within the community. The Gini coefficient for the country as a whole in the same year was 0.358 (though that comparison is not without its problems)
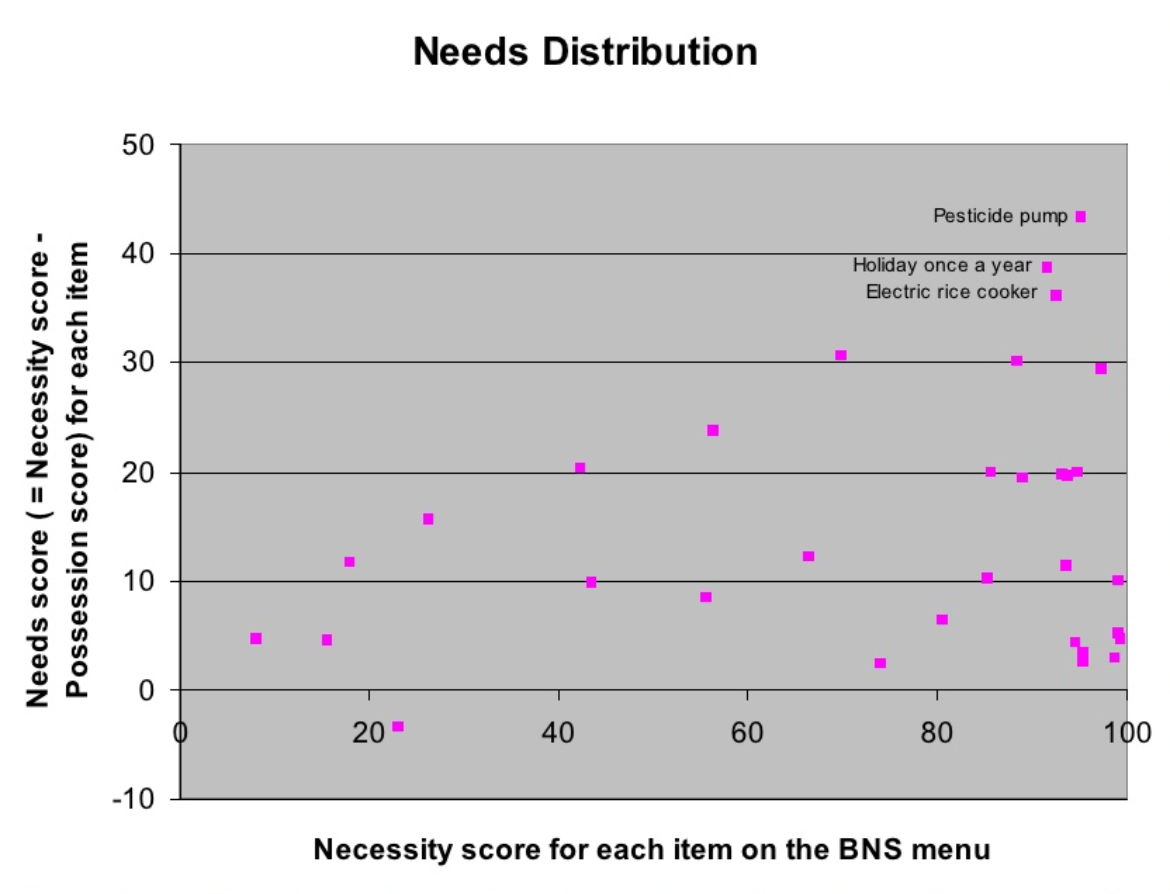
Identifying needs
The following graph uses data from the 1997 Vietnam (Can Loc) BNS. The X axis represents the proportion of respondents who said an item was a basic necessity. Needs scores for individual items = (the necessity score for that item) - (proportion of respondents possessing that item)
DEVELOPING Simpler predictive models of poverty status
There may be times when development project staff want to quickly identify the poverty status of a household, without going through a whole survey process. For example, to check the entitlement of a household to be included in an activity, or to check whether their status has changed as a result of inclusion. In these situations, all that may be needed is knowledge of whether a household is poor or not, not a more specific measure of their degree of poverty.
One way of doing this is to use a much shorter checklist, which can be derived from prior survey findings like the 2006 Vietnam BNS. One way of constructing such a checklist is in the form of a Decision Tree. A series of questions are asked and depending on the answers, the household concerned is classified as poor or not poor. The issue then is how to design such a Decision Tree. One means of doing so is to use a Decision Tree algorithm, usually found within more generic data mining packages such as RapidMiner. I have written a detailed account of the uses of Decision Trees as representations, and how to develop them, here. A Decision Tree algorithm can be used to find associations between survey responses, for example between specific items a household said they have, and their overall BNS poverty score. It then represents these associations in the form of a Decision Tree.
Here below is a Decision Tree model produced by RapidMiner. Each branch is a different predictive model, that applies to a different sub-set of households. They can be read as follows:
-
- If a household does not have a "toilet made of stone" and does not have "an electric rice cooker" then it will be poor. When this prediction rule is applied to the BNS dataset 112 households were actually poor and 15 were not
- If a household does have a "toilet made of stone" and does have "a thick blanket" then it will be not poor. When this prediction rule is applied to the BNS dataset 334 households were not poor and 59 were poor
That mix is in effect a probability statement that respondents with those possessions will be poor or not. For example, at the end of the far right branch, the mix of 334 and 59 households means there is an 85% (334/393) likelihood that households with that branch's combination of possessions will not be poor
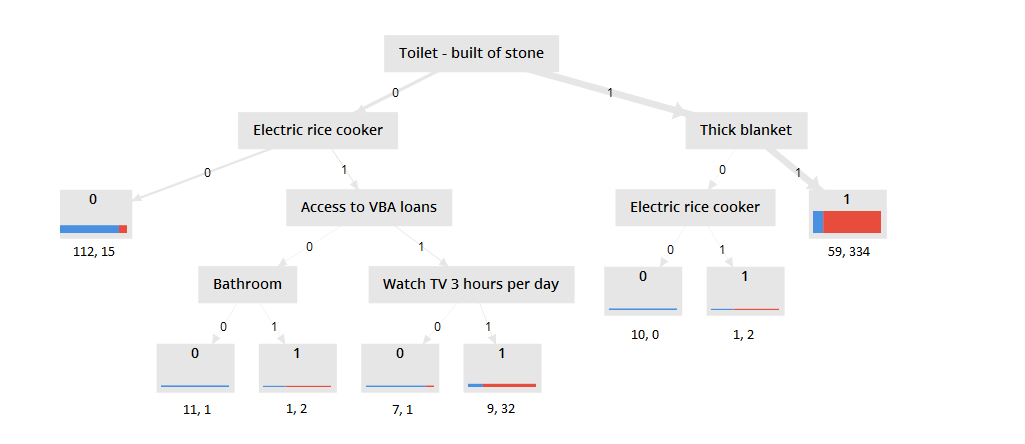
We can also measure the overall accuracy of the whole tree, made up of 8 different models (branches). This Decision Tree has an overall accuracy of 85%, with 3% False Positives (classified as poor but not really poor) and 12% False Negatives (classified as not-poor but not really not-poor).
By the way, how does this compare to other efforts to do similar things? The World Bank has tested out a battalion of different algorithms to find which would produce the best predictive model of household poverty status in 3 countries, using national household surveys as the source of outcome status to be predicted. Their models ranged from 80% to 91% accuracy. See video and PowerPoint slides of a World Bank policy research talk in February 2018 by Olivier Dupriez on “Machine Learning and the Future of Poverty Prediction”
Network visualisation of relationships
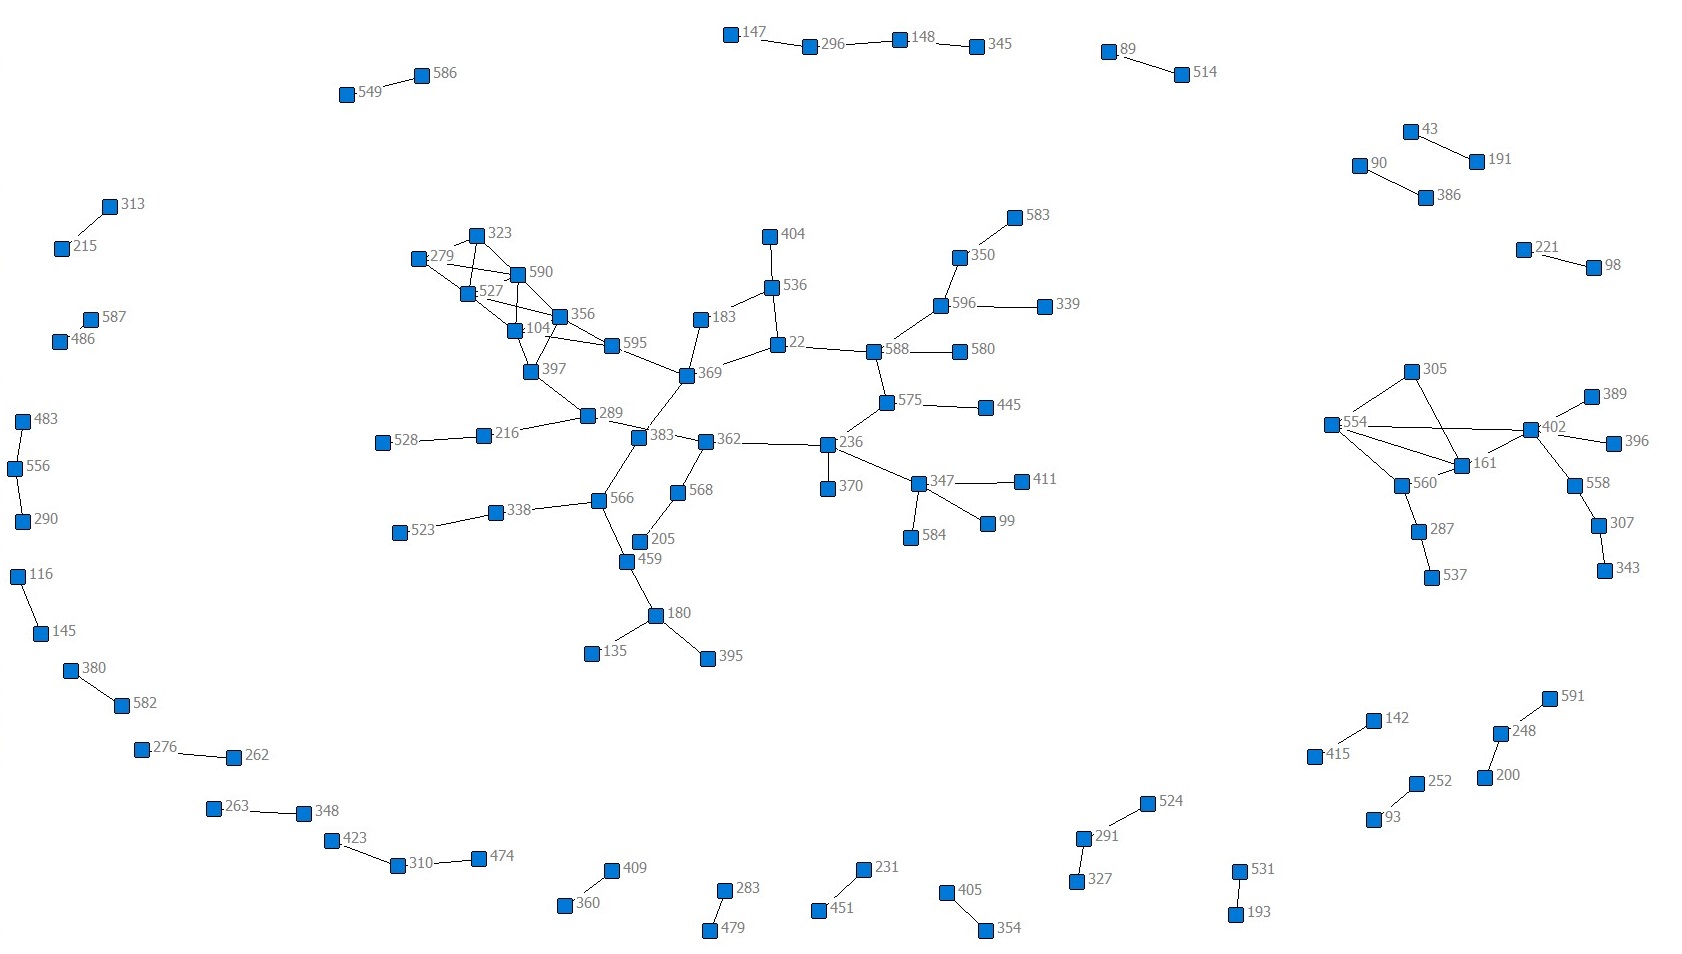
Households surveyed with the BNS can be seen as connected to each other by similarity, to the extent that they possess the same sets of items on the BNS menu. Clusters of such households can be visualised and identified using social network analysis (SNA) software, such as UCINET&Netdraw.
For this visualisation below I imported the Vietnam 2006 BNS data in a matrix form, where rows = respondents representing households and columns = items on the BNS menu, with cell contents of 0 or 1 representing the row household's possession, or lack of, the column item. I then carried out these steps: (a) converting this two mode matrix into a one mode matrix showing households x households, where cell values represented the number of the same items they both possessed; (b) calculated the maximum number of items households shared with others; (c) displayed the matrix as a network diagram using NetDraw, showing only those relationships with the maximum number of shared items on the menu used in this BNS survey. These households represented about 18% of the households surveyed.
A second type of network visualisation is also possible using BNS data.This would show households linked by shared views of what are and are not basic necessities. The literature that does exist on BNS and other "consensual" measures of poverty indicates that gender and other differences do not make a big difference to what people perceive as necessities. But these are single factor theories. It may be that combinations of respondent attributes are associated with differences in perceptions of necessities. A network visualisation is one way of potentially finding such groups. Cluster analysis algorithms are another way.
5. Research which informed the design of the BNS
These documents informed the design of the BNS in 1997 :
- Mack, J., and Lansley, S. (1985) Poor Britain. Allen and Unwin. London. This reports on a 1983 survey.
- "Only those items seen as a necessity by a majority of the population are classed as a 'necessity'". The BNS adopted this feature.
- The survey asked people to distinguish between items they lacked because they could not afford and those they lacked because they did not want them. The BNS does not make this distinction.
- They defined poverty as ‘an enforced lack of socially perceived necessities". Households lacking three or more necessities were deemed poor because deprivation on this scale was judges as likely to be enforced rather than chosen. The BNS does not use this criteria.
- Frayman, H (1991) Breadline Britain 1990s. Booklet by London Weekend Television. This repeats the same survey in 1990, using the same definition and measurement approach
- Gordon, D., Pantazis, C (eds) (1997) Breadline Britain 1990s. Ashgate Publishers Ltd.
UK. This reports further analysis of the 1983 and 1990 surveys - Hallerod, B. (1994) A New Approach to the direct consensual measurement of poverty. Social Policy Research Centre Discussion Paper No. 50. University of New South Wales.
- Hallerod constructed a "Proportional Deprivation Index" uses weightings from all items.
- Hallerod, B. (1994) Poverty in Sweden: A New Approach to the Direct Measurement of Consensual Poverty. UMEA Studies in Sociology No. 106. Umea University. Umea.
The BNS is innovative in that it combines: (a) the use of Mack and Lansley's 50% cut-off point AND (b) Hallerod's weighting for items based on the proportion of respondents saying an item is a basic necessity. In addition, the method used to define a poverty line, within a range of BNS scores, is also unique to the BNS. Combined together, the BNS provides both a headcount measure and a depth-of-poverty measure.
6. Reports on its use
Use In Vietnam - 1997 and 2006
- The 2006 Basic Necessities Survey (BNS) in Can Loc District, Ha Tinh Province, VietnamA report by the Pro Poor Centre and Rick Davies.
- There is also an online PowerPoint presentation of the results of this survey, 2007
- Beyond Wealth Ranking: The Democratic Definition and Measurement of Poverty A Briefing Note prepared by Rick Davies (CDS Swansea for the ODI Workshop "Indicators of Poverty: Operational Significance", held on Wednesday, 8 October 1997 in London.
- The Basic Necessities Survey:. the experience of ActionAid Vietnam. Rick Davies and William Smith, Hanoi, Vietnam September, 1998.
AN online bibliography on the use of the BNS
There is now an online bibliography of papers referring to the use of the BNS, available here: https://www.zotero.org/groups/2440491/basic_necessities_survey/items/order/year/sort/desc
There were 66 items in the bibliography, as of mid 2021. Many of these only refer to the use of the BNS in specific sub-sections, in the context of a wider process of research.
Manuals on the use of a BNS
- Detoeuf, D., Wieland, M., & Wilkie, D. (2020). Guide 2.0 to the Modified Basic Necessities Survey: Why and How to Conduct Digital-Based BNS in Conservation Landscapes.
- USAID (2015) A guide to the modified Basic Necessities Survey: Why and how to conduct BNS in conservation landscapes. New York, USA
- WCS (2013) REDD and Livelihoods. Includes 8 slides explaining how to do a BNS
-
Wilkie, D. (2012). Assessing the impact of conservation and development on rural livelihoods—Using a modified Basic Necessities Survey (BNS) in experimental and control communities. Wildlife Conservation Society.
- USAID Wildlife Conservation Society Technical Manual 4 (2007) Household surveys - a tool for conservation design, action and monitoring. Pages 8-11 describe the use of the BNS
Related methods and sources
- The use of weighted checklists to assess the performance of services having more than one dimension to their performance. Such as health centres or schools. These can combine measures of expectations and actual performance, and combine both in an aggregate performance score
- The Poverty and Social Inclusion website has a large amount of material in the definition and measurement of poverty
- Schreiner's Simple Poverty Scorecard (SPS). See my comparison of the SPS with the BNS
- The Grameen Foundation has subsequently developed and widely promoted, the Progress Out of Poverty Score, based on Schreiner's method
- There has been some questioning about the applicability of the Progress out of Poverty Index, particularly from NGOs. "For instance, there is only one PPI Index for India, yet everyone knows that poverty lines are much different in the North vs. South and rural vs. urban"
- The Grameen Foundation has subsequently developed and widely promoted, the Progress Out of Poverty Score, based on Schreiner's method
Monitoring and Evaluation is the key for change and development. The presence of a project or a program without monitoring and evaluation is not fruit full and cannot effectively and efficiently utilize the available resources for the project or program implementation or delivery. So, the development efforts on monitoring and evaluation is very crucial and important as it gives ways, mechanisms or systems in which the objective projects or programs. I am happy to be part of this association. I would like to thank the organizers for providing this learning and information sharing opportunity on monitoring and evaluation.
Who are eligible to attend the Swiss Evaluation Society (SEVAL) and Geneva Evaluation Network (GEN) conference
I suspect it is anyone who pays the conference fee :-) But check their website… there must be one
How much is the conference fee per participant? Is it possible for you to send an invitation letter for two?
If Africa is to really change in how it is being governed, independent monitoring and evaluation has to be made its integral companion.
I wish to attend a knowledge sharing workshop on M&E of projects in the Asian region, to get improved my career. can you help me please.?
Kandawela
M&E officer
SPEnDP
Srilanka
I want to attend the monitoring & evalaution workshops, would you please help me how to apply & the procedures?
Mulat Tilahun
M&E Officer
Ethiopia
I am requesting for more details on participation.I come from Kenya and I am m&E PRACTITIONER
I am an M & E officer for a project in Africa dealing with conflict resolution. I am highly motivated on M & E issues and like to have an opportunity of sharing which I hope you can help me out. I will like to appreciate your work in supporting such initiatives.
Alhaji Sali Usmanu
I am M&E officer working in humanitarian organisation and I wish to attend this knowledge sharing conference on M&E. can you help me how to apply or proceed please.?
Mulat
Hello,
I am a M&E student working on obtaining my Diploma from the Liberian Institute of Public Administration (LIPA). I have great interest in the course and wish to advance in any ways. Attending this knowledge sharing conference will impact me greatly.
Hello, Everyone!
I am looking to embark on an academic research on ‘Mainstreaming Monitoring and Evaluation System in Public Institutions for Effective Peacebuilding and Development Projects Implementation.
Kindly assist me with materials by giving me links and sending me what you have.
I work on M&E at the Ministry of Communications in Egypt. I work on Project with UNDP. I =attended an Advanced Monitoring and Evaluation course by INTRAC in Oxford, UK in year 2010 which has benefited me a lot. I am eager to get a training on Impact Studies. Kindly respond. Thanks.
I am working as Impact Measurement Manager at an NGO called Teach For Lebanon. I would like to improve my skills and knowledge by attending workshops and conferences related to M&E. Please advise!
Dear Conference organizers
Kindly send me an invitation to attend this very important conference for this year 24- 29 October 2016.
i need this invitation urgently in order for permission and funds to be released as soon as possible
Thank you
Am working as monitoring and Evaluation officer in an NGO specifically concerned with HIV prevention, i would like to attend the conference to attain more experience in using the latest approaches in my daily M&E practices.
Hello. Am an M&E Director for an International NGO. I request for information on how to attend the conference.
Hi, am interested to attend the above M*E training/workshops/symposium. what are the criteria for attending them.These will help me build more for my organization.
Could you please share with me some links and information on developing M&E strategy for organizations,M&E plan and Frameworks
waiting for response
+256706434381
Solomon Lukyamuzi
M&E Officer
DSW Uganda
I like to have an opportunity of sharing which I hope you can help me out. I will like to appreciate your work in supporting such initiatives.
Hi, kindly provide me with information on a one week training in M&E, data analysis, SPSS and the like in Mumbai india in March 2017
Good day,am a non-member of CREA but am interested in attending the forthcoming 2017 4th conference at Chicago in September.
I am interested in coming for the conference and needs an invite from CREA to my workplace to be able to attend.
My organisation’s name is University of Ibadan and the mailing address is
NO 7 Parry Road
Centre for Petroleum Energy Economics and Law
University of Ibadan
Nigeria
West Africa
Grateful if you can provide me with detail information about the M&E conference such as; what is required to attend, eligibility, payment etc.
Please contact the organizers of the conferences listed here, via the link provided within the post
Dear Rick,
I was working for ActionAid the Gambia as M&E Officer. I even worked with in development Area2. I want to ask if I want to become a member of the M&E Network, what do I do.
Thank you
Momodou A. Jallow
Go to
https://groups.yahoo.com/neo/groups/MandENEWS/info
and sign up there
regards, rick
This year Ministry of Economic Development and Polish Agency for Enterprise Development hosts 12th International Evaluation Conference “Evaluation that matters. Ways to improve public policies.” The event will take place in Wroc?aw 21st – 22nd June in Mercure Hotel at plac Dominika?ski 1. The aim of the conference is to present the results of public policies in the European Union. The evidence provided by the evaluation study not only illustrates the results of the actions taken, but also explains the socio-economic mechanisms, opportunities and barriers of the countries concerned.
The conference is a forum for increasing knowledge and skills, exchanging experience and research results. Thanks to this event, specialists involved in the evaluation process at various stages have a great opportunity to meet, develop contacts and understand different points of view. We are confident that this will have a significant impact on the preparation of high-quality evaluation research. By enhancing the quality of research and releasing the potential of institutions involved in the evaluation process, we contribute to a better policy.
The conference is organised by the Ministry of Economic Development and Polish Agency for Enterprise Development.
The conference is a forum for increasing knowledge and skills, exchanging experience and research results. Thanks to this event, specialists involved in the evaluation process at various stages have a great opportunity to meet, develop contacts and understand different points of view. We are confident that this will have a significant impact on the preparation of high-quality evaluation research. By enhancing the quality of research and releasing the potential of institutions involved in the evaluation process, we contribute to a better policy.
The history of our conference dates back to 2005 when we organized the first edition of the event. Since then, our mission has remained the same and for the past twelve years we have been developing evidence, skills and knowledge across Europe so that we can obtain the best possible results of our work. “Results” is the keyword of our conference. The objective of the 12th conference is to present outcomes of public policies based on evidence from evaluation. Evidence delivered by the evaluation process not only present outcomes of taken up actions but also explain mechanisms, opportunities and barriers of particular economies. The second goal of this year’s event is to point out to fields which might present challenges for evaluation units in the near future. New technologies, developing and demanding both fields and methods and institutional determinants that influence final results importantly will constitute the second pillar of the event.
During this year’s event we will focus on broadly defined systems of evaluation encompassing both evaluation culture and evaluation methodology. Participants will be able to learn from four different panels: (1) Causal effects in evaluation, (2) Evaluation culture across the world, (3) Evaluation of development programmes, and (4) Application of serious games in evaluation. We will also discuss outcomes of policies implemented within European Union during the last couple of years, stressing especially those that reflect results of cohesion policy.
I am an Assistant Director M&E at Ministry of Economic Planning & Budget, in Ondo State, Nigeria.
I am interested to attend the conference, can i get detailed information on how to apply?
Thanks
Please contact the conference organisers directly, via the link on this posting
Dear Sir,
I’m interested to coming November 2017 conference. Is it possible? Let me know.
M&E conferences ans seminars in Africa
I have interest in the conference participation.I come from Liberia and I am a Monitoring & Evaluation Specialist.
If you send Invitation letter to attend the conference its fine. with total cost
Are there any M&E events, conferences being organized in Europe in 2024?